Blob Statistics
What Are Blob Statistics?
Blob statistics are data that we process and get from the trained/labeled objects (called "blobs") in an image. These blobs are shapes that the camera sees and marks based on the training data. We measure things like how big they are, what color they are, and where they are.
These statistics help us:
- Check if parts are made correctly
- Count and sort items
- Watch for changes in objects over time
- Make accurate measurements
Why It Matters
- Catch issues early – spot defects like scratches, missing parts, or misalignments before they become bigger problems
- Save time and effort – automatically check for quality instead of doing it by hand
- Speed up production – streamline inspection right on the assembly line
- Measure with extreme precision – pixel level accuracy
- Use the data for more – send results to Node-RED for dashboards, math-based calculations, quality control (QC) decisions, or triggering alerts
- Drive continuous improvement – track trends, compare units, and refine your process using real measurements
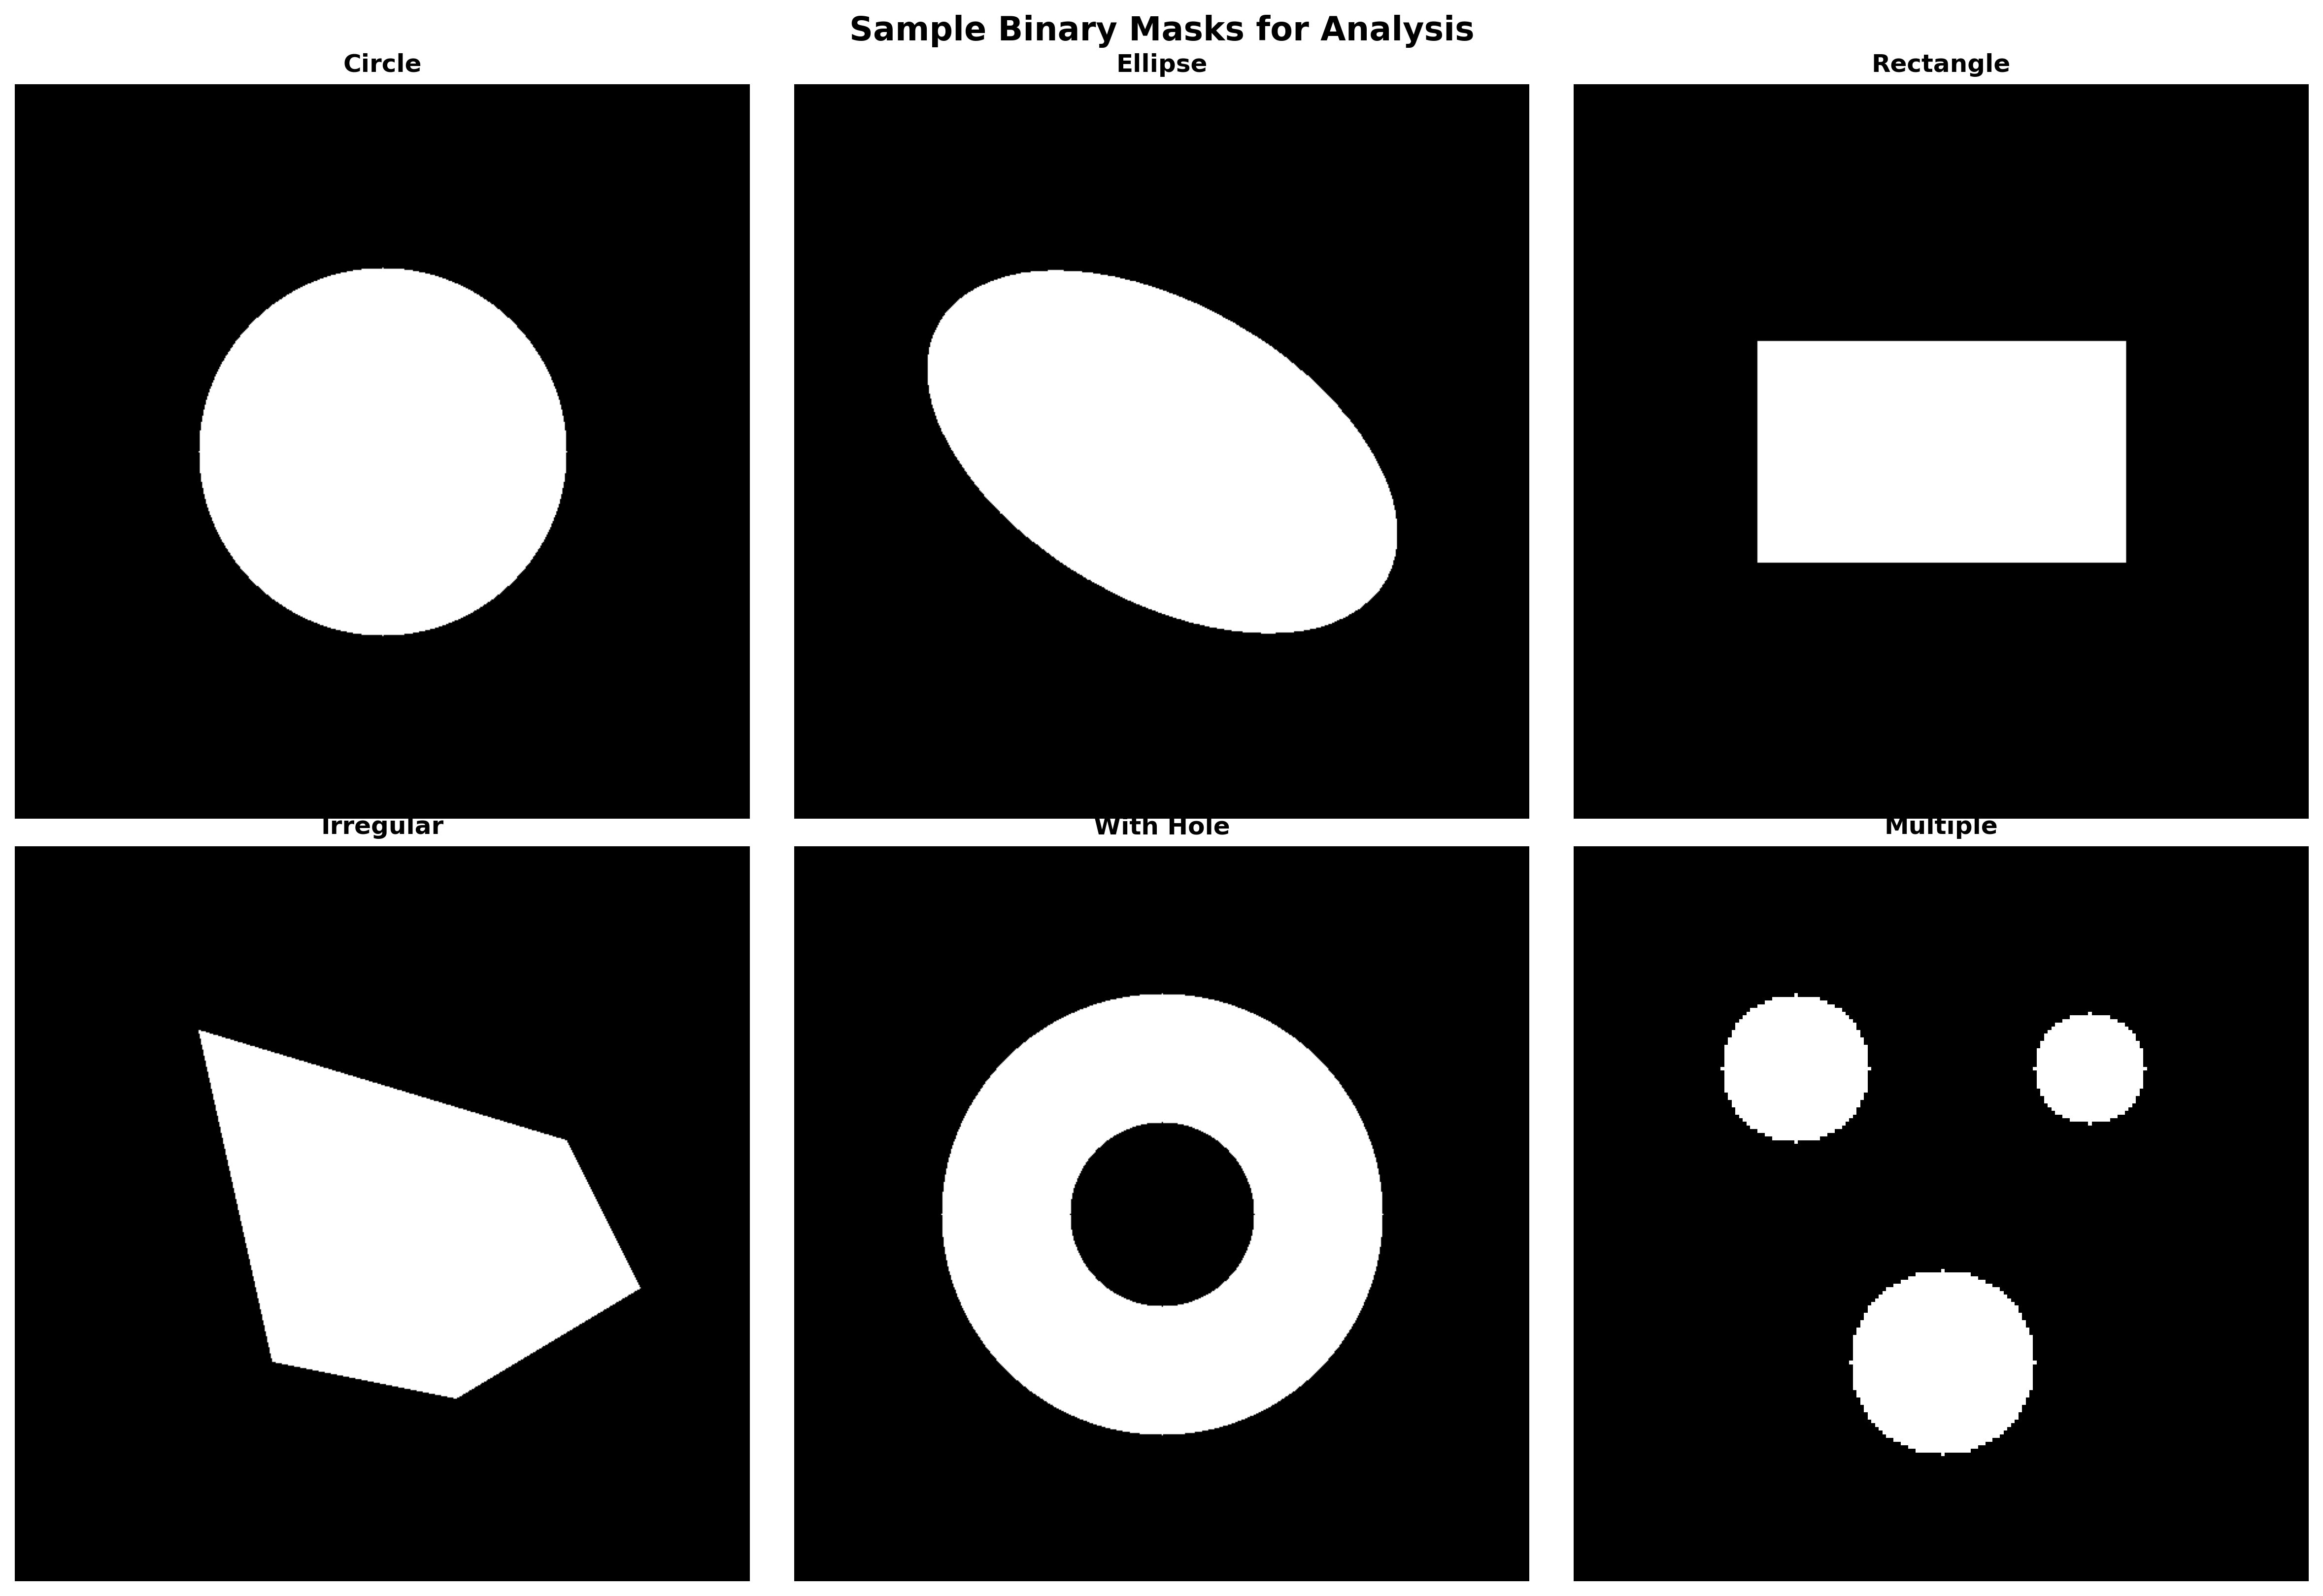
1. Finding Shapes in Images
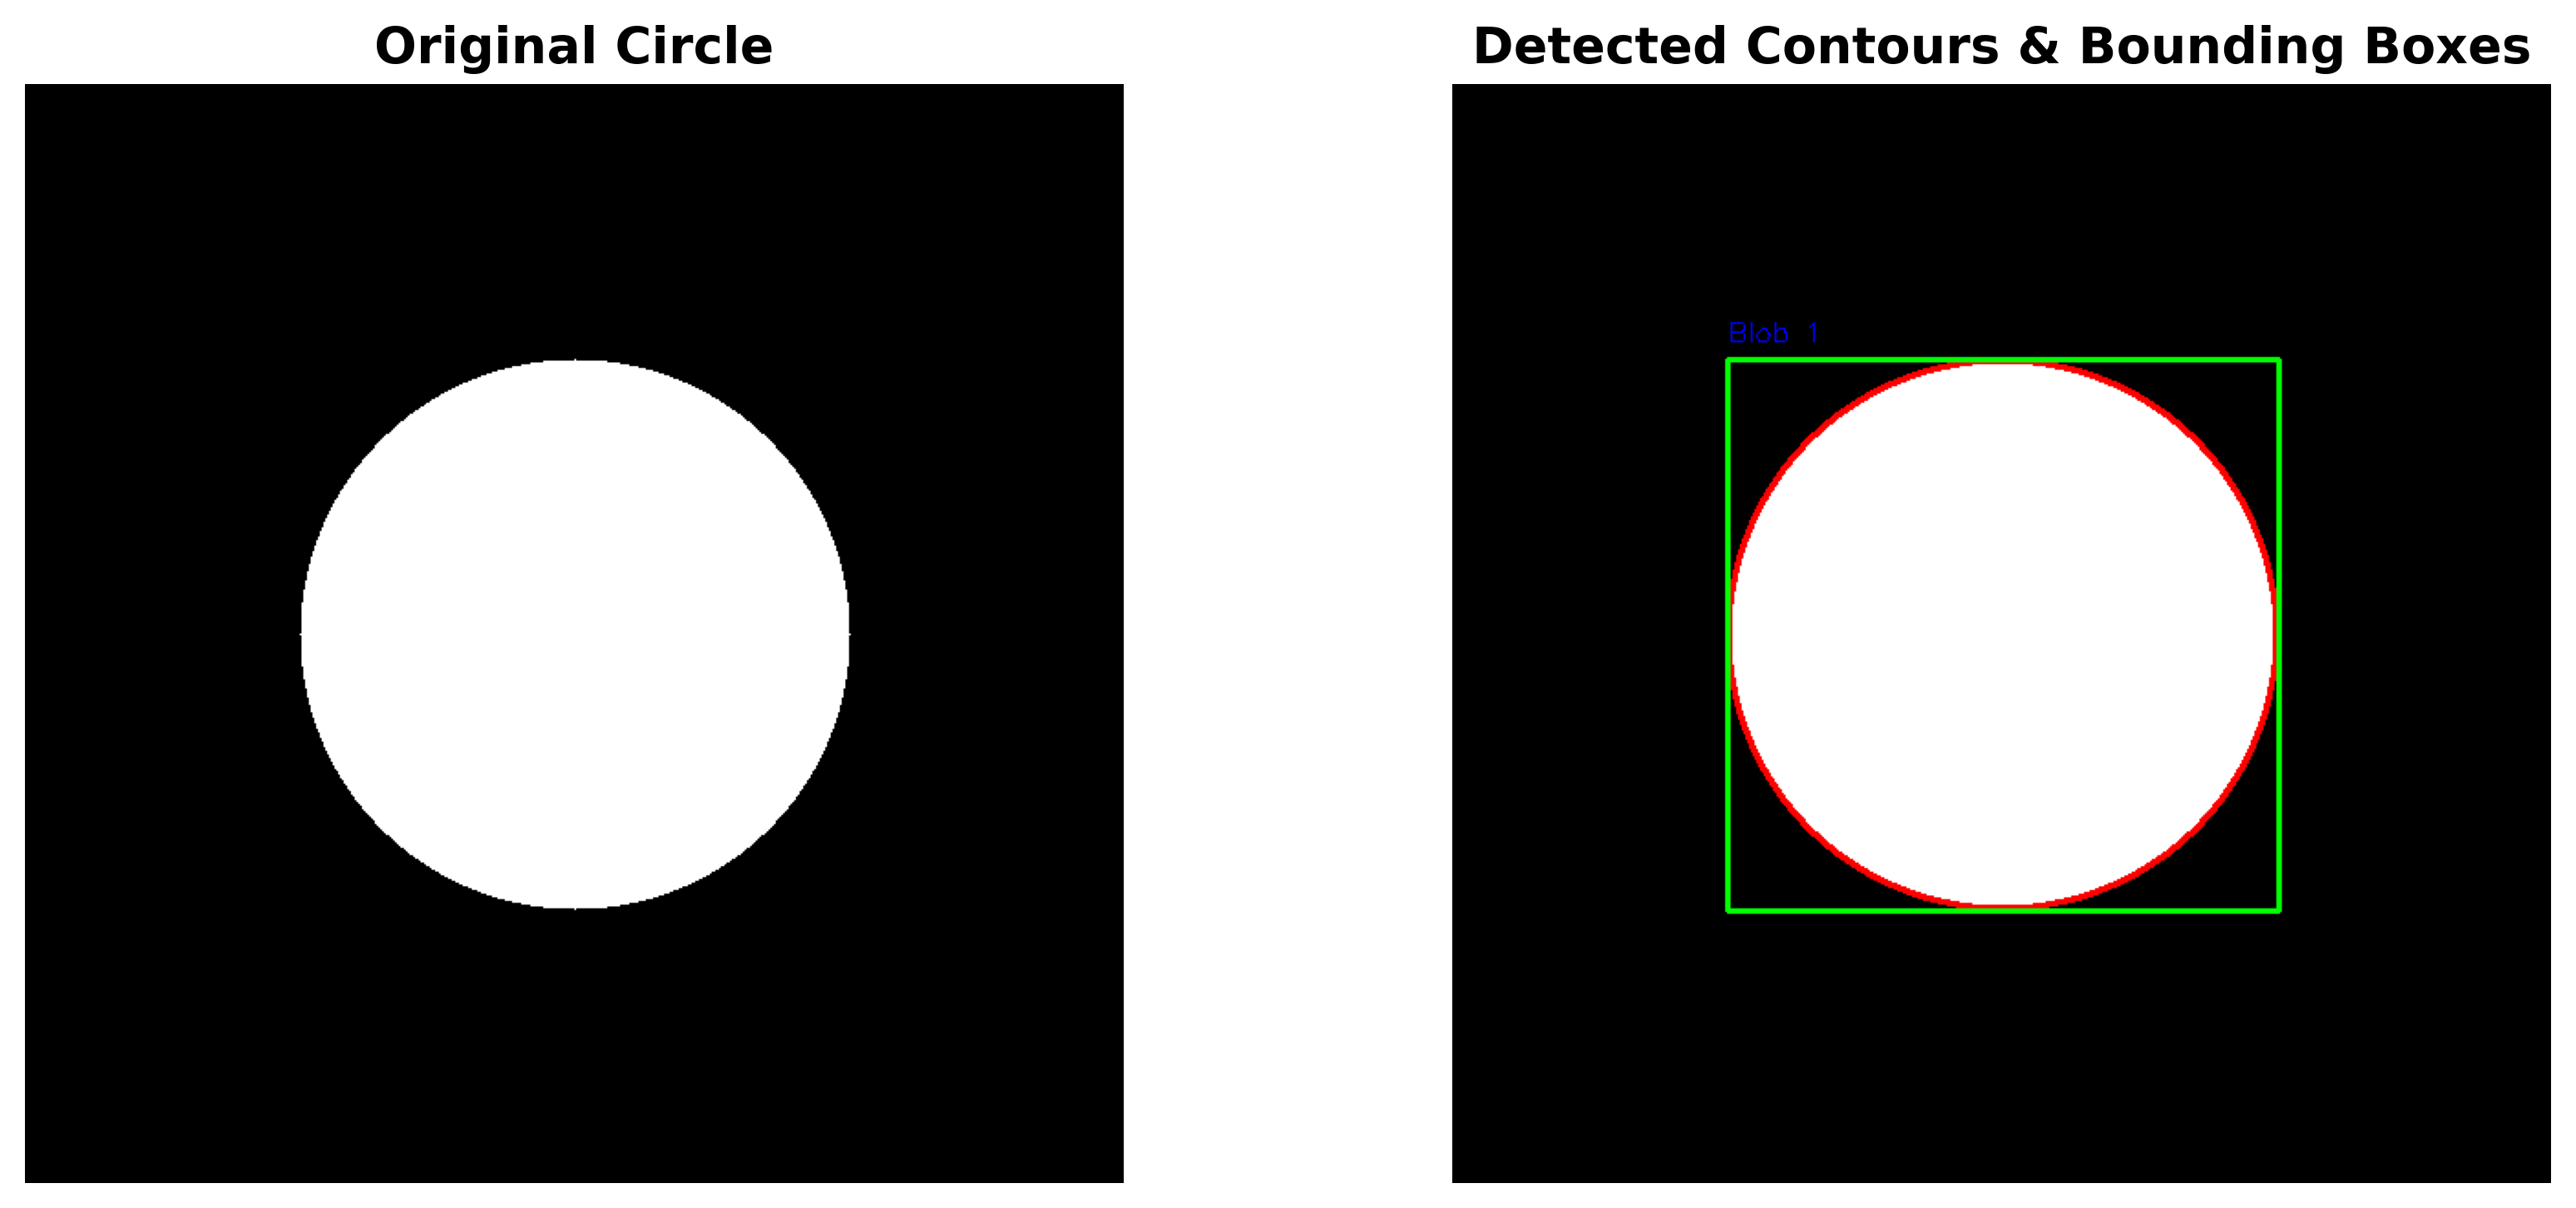
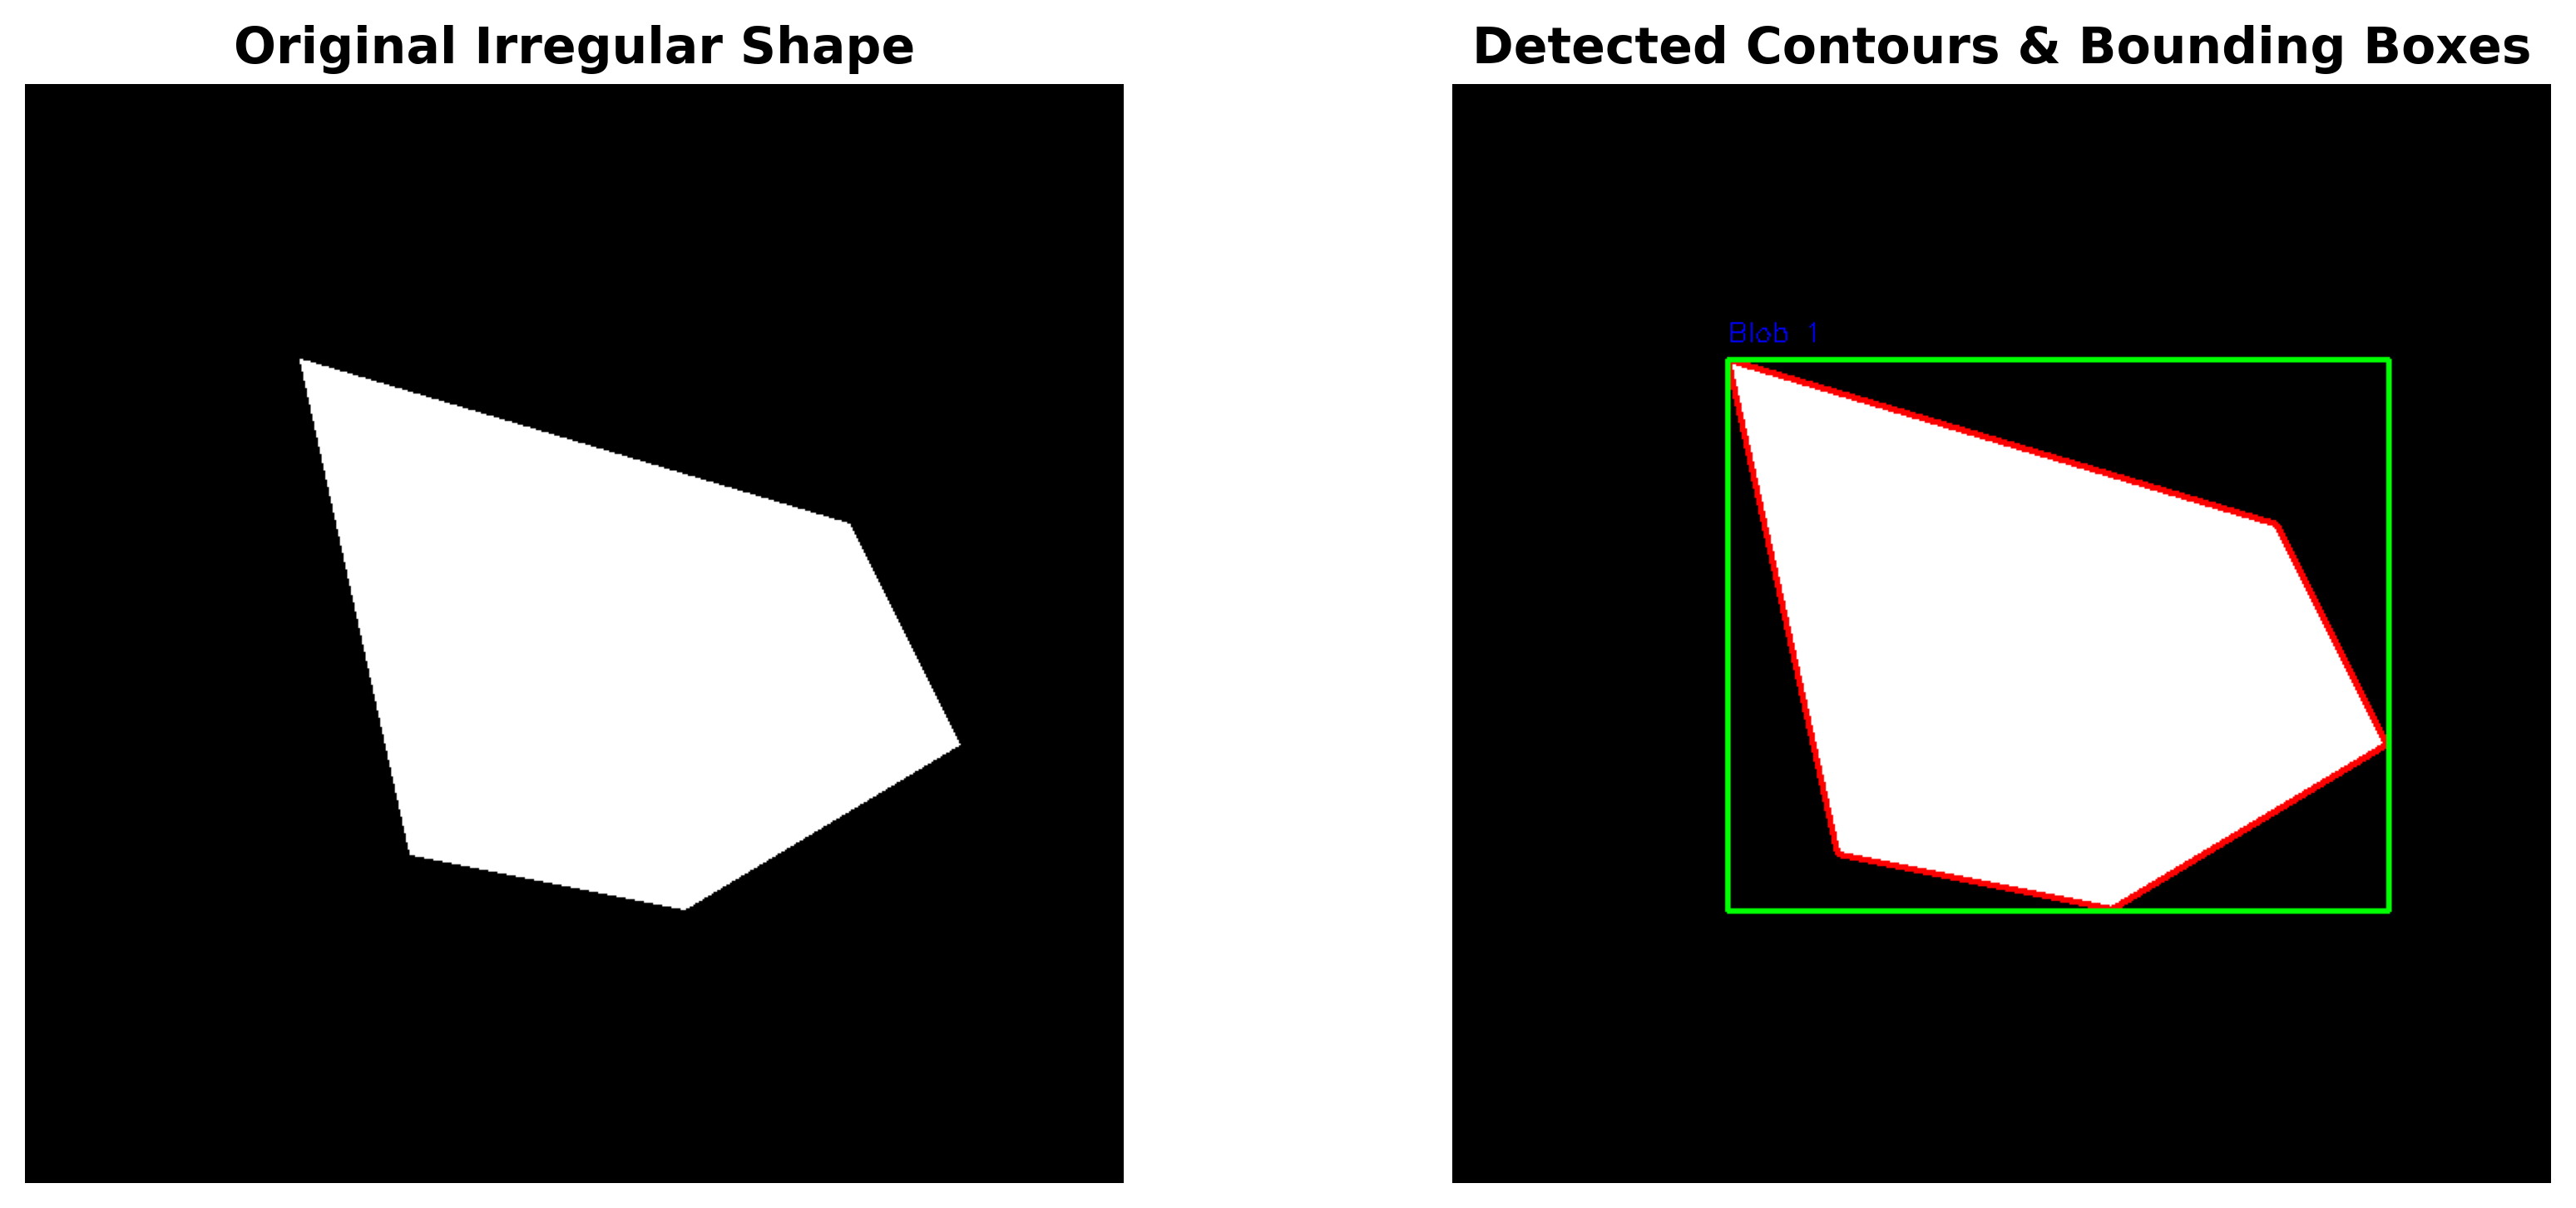
First, we look for blobs (shapes) in the image. We draw outlines around each shape.
- Contours: Lines around the shapes
- Bounding Box: A rectangle that fits around the blob
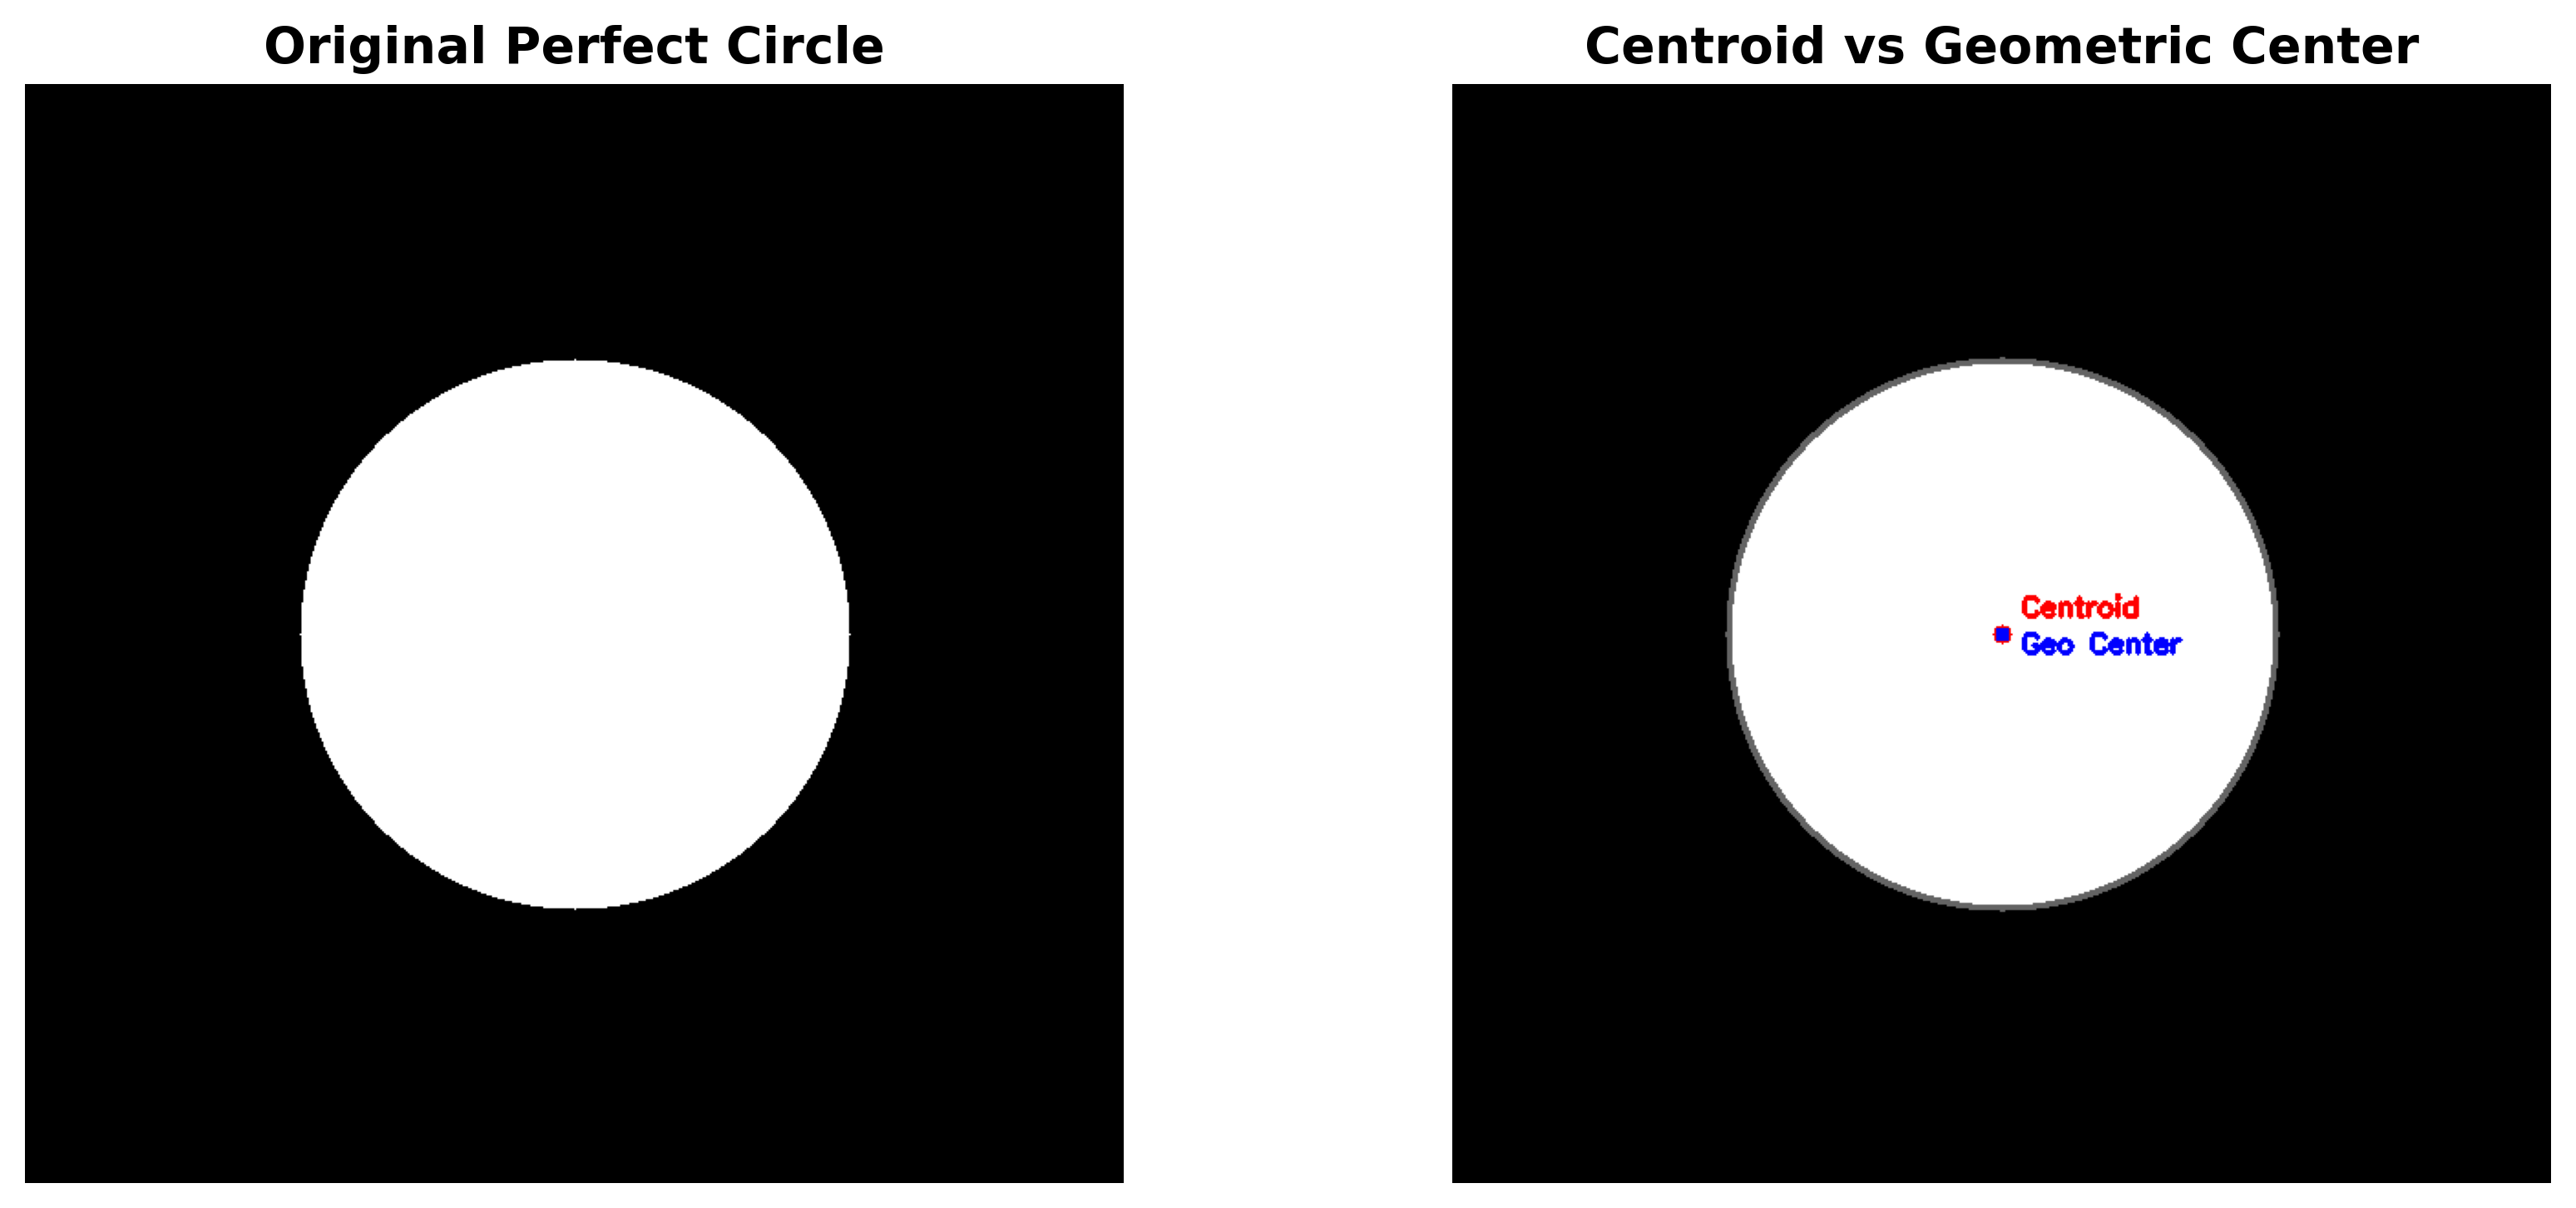
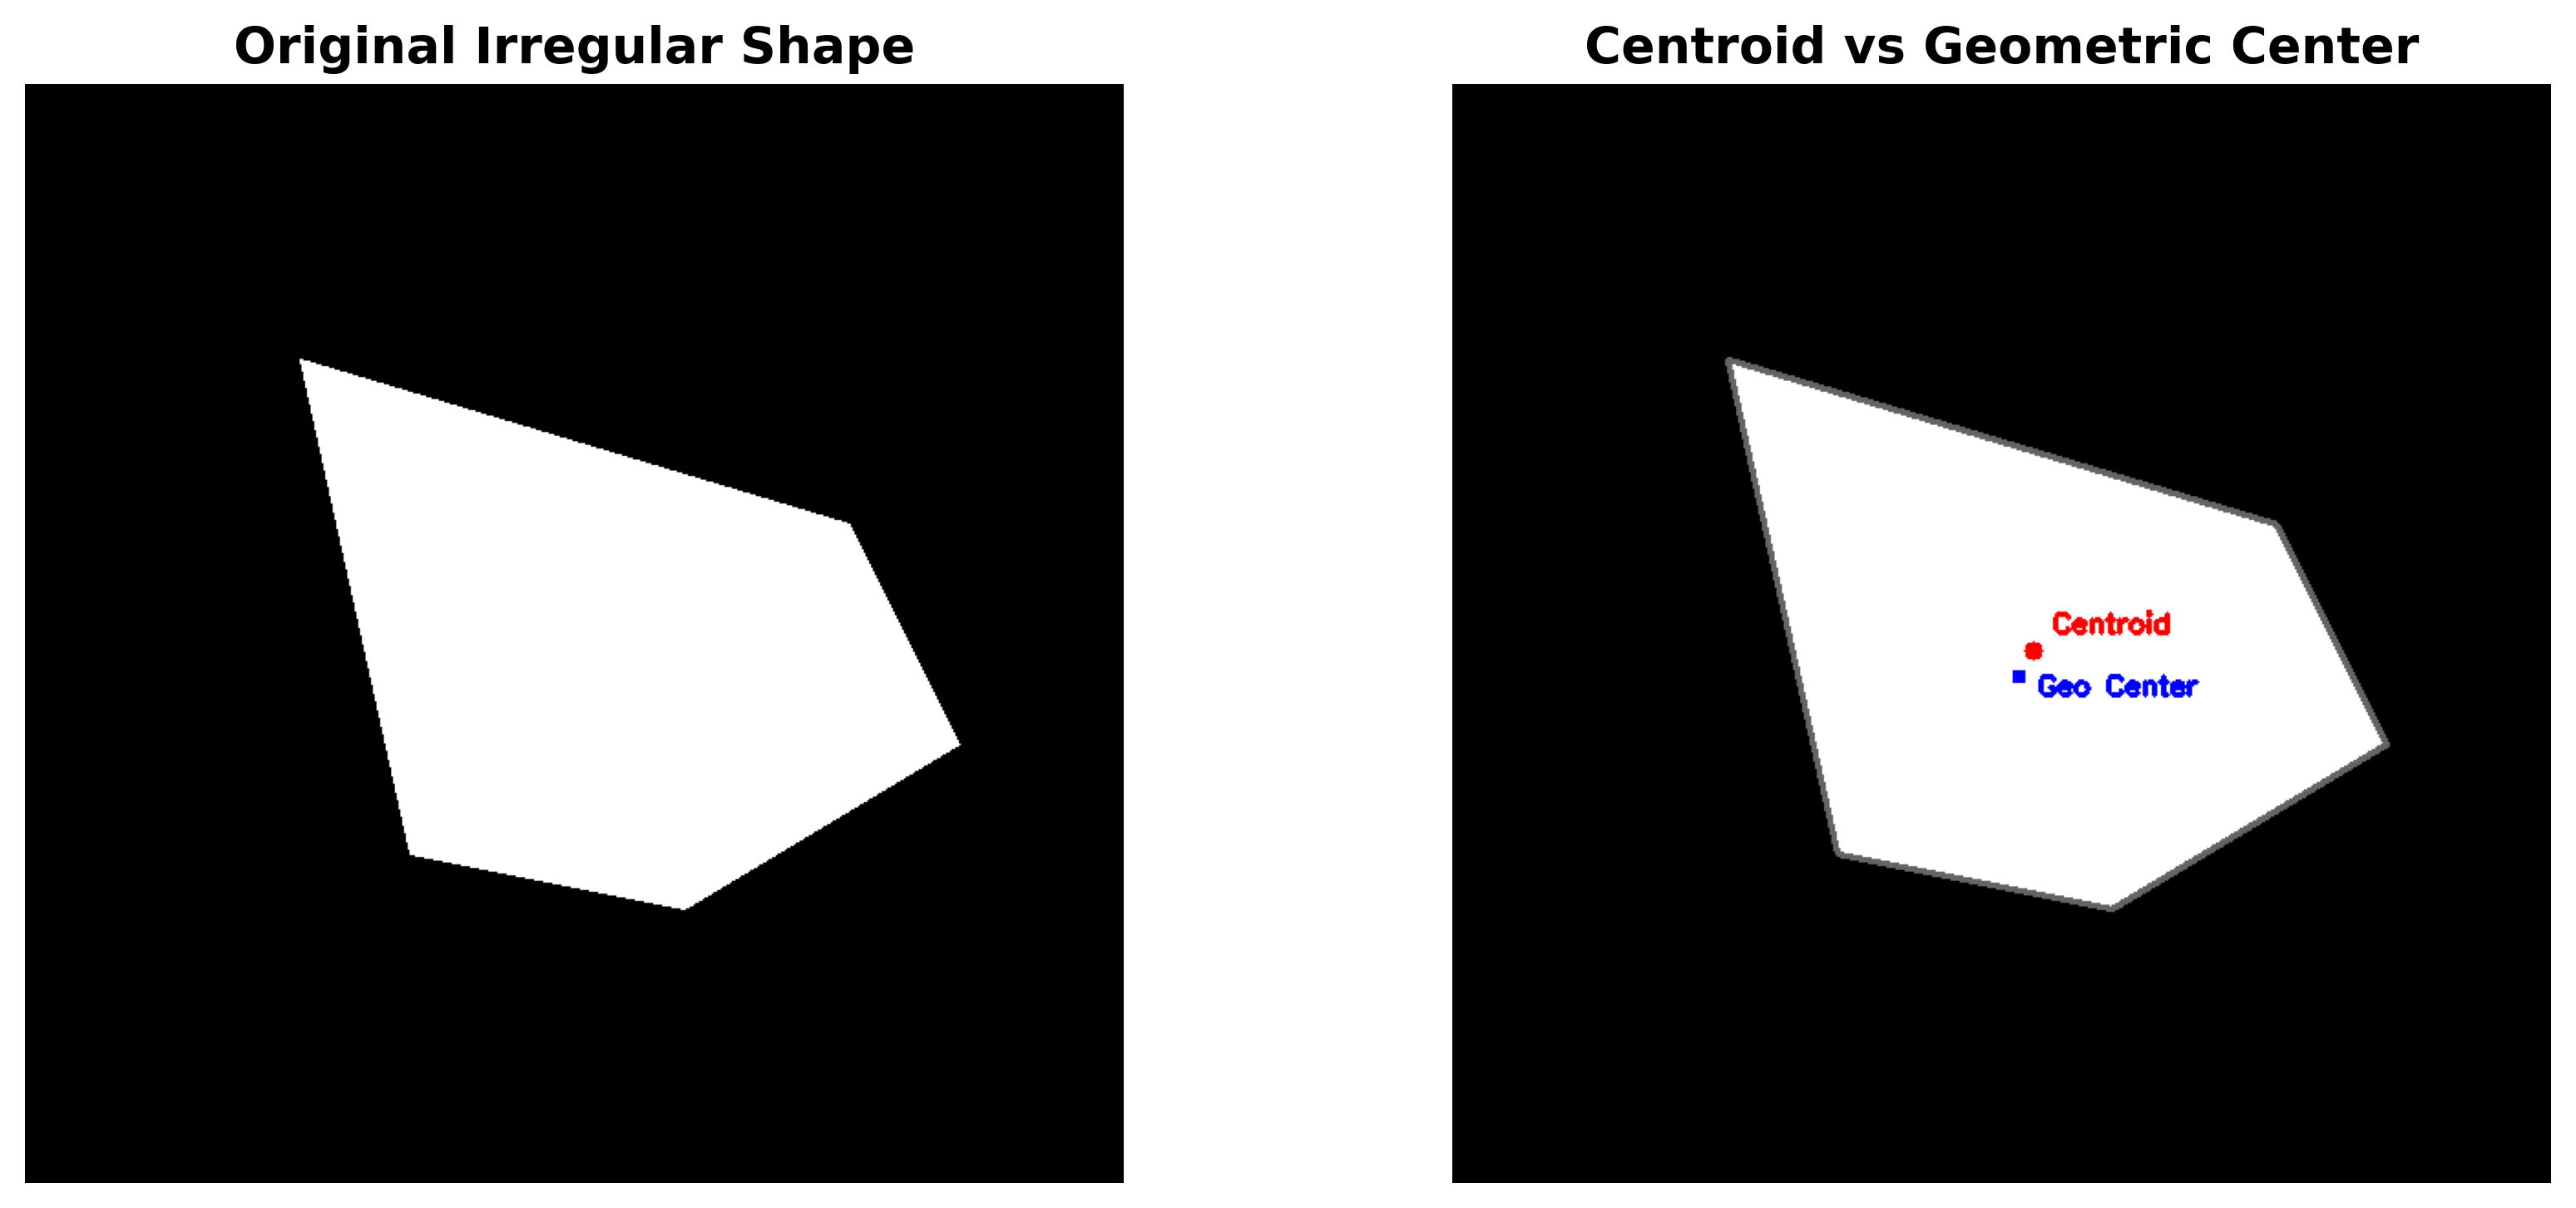
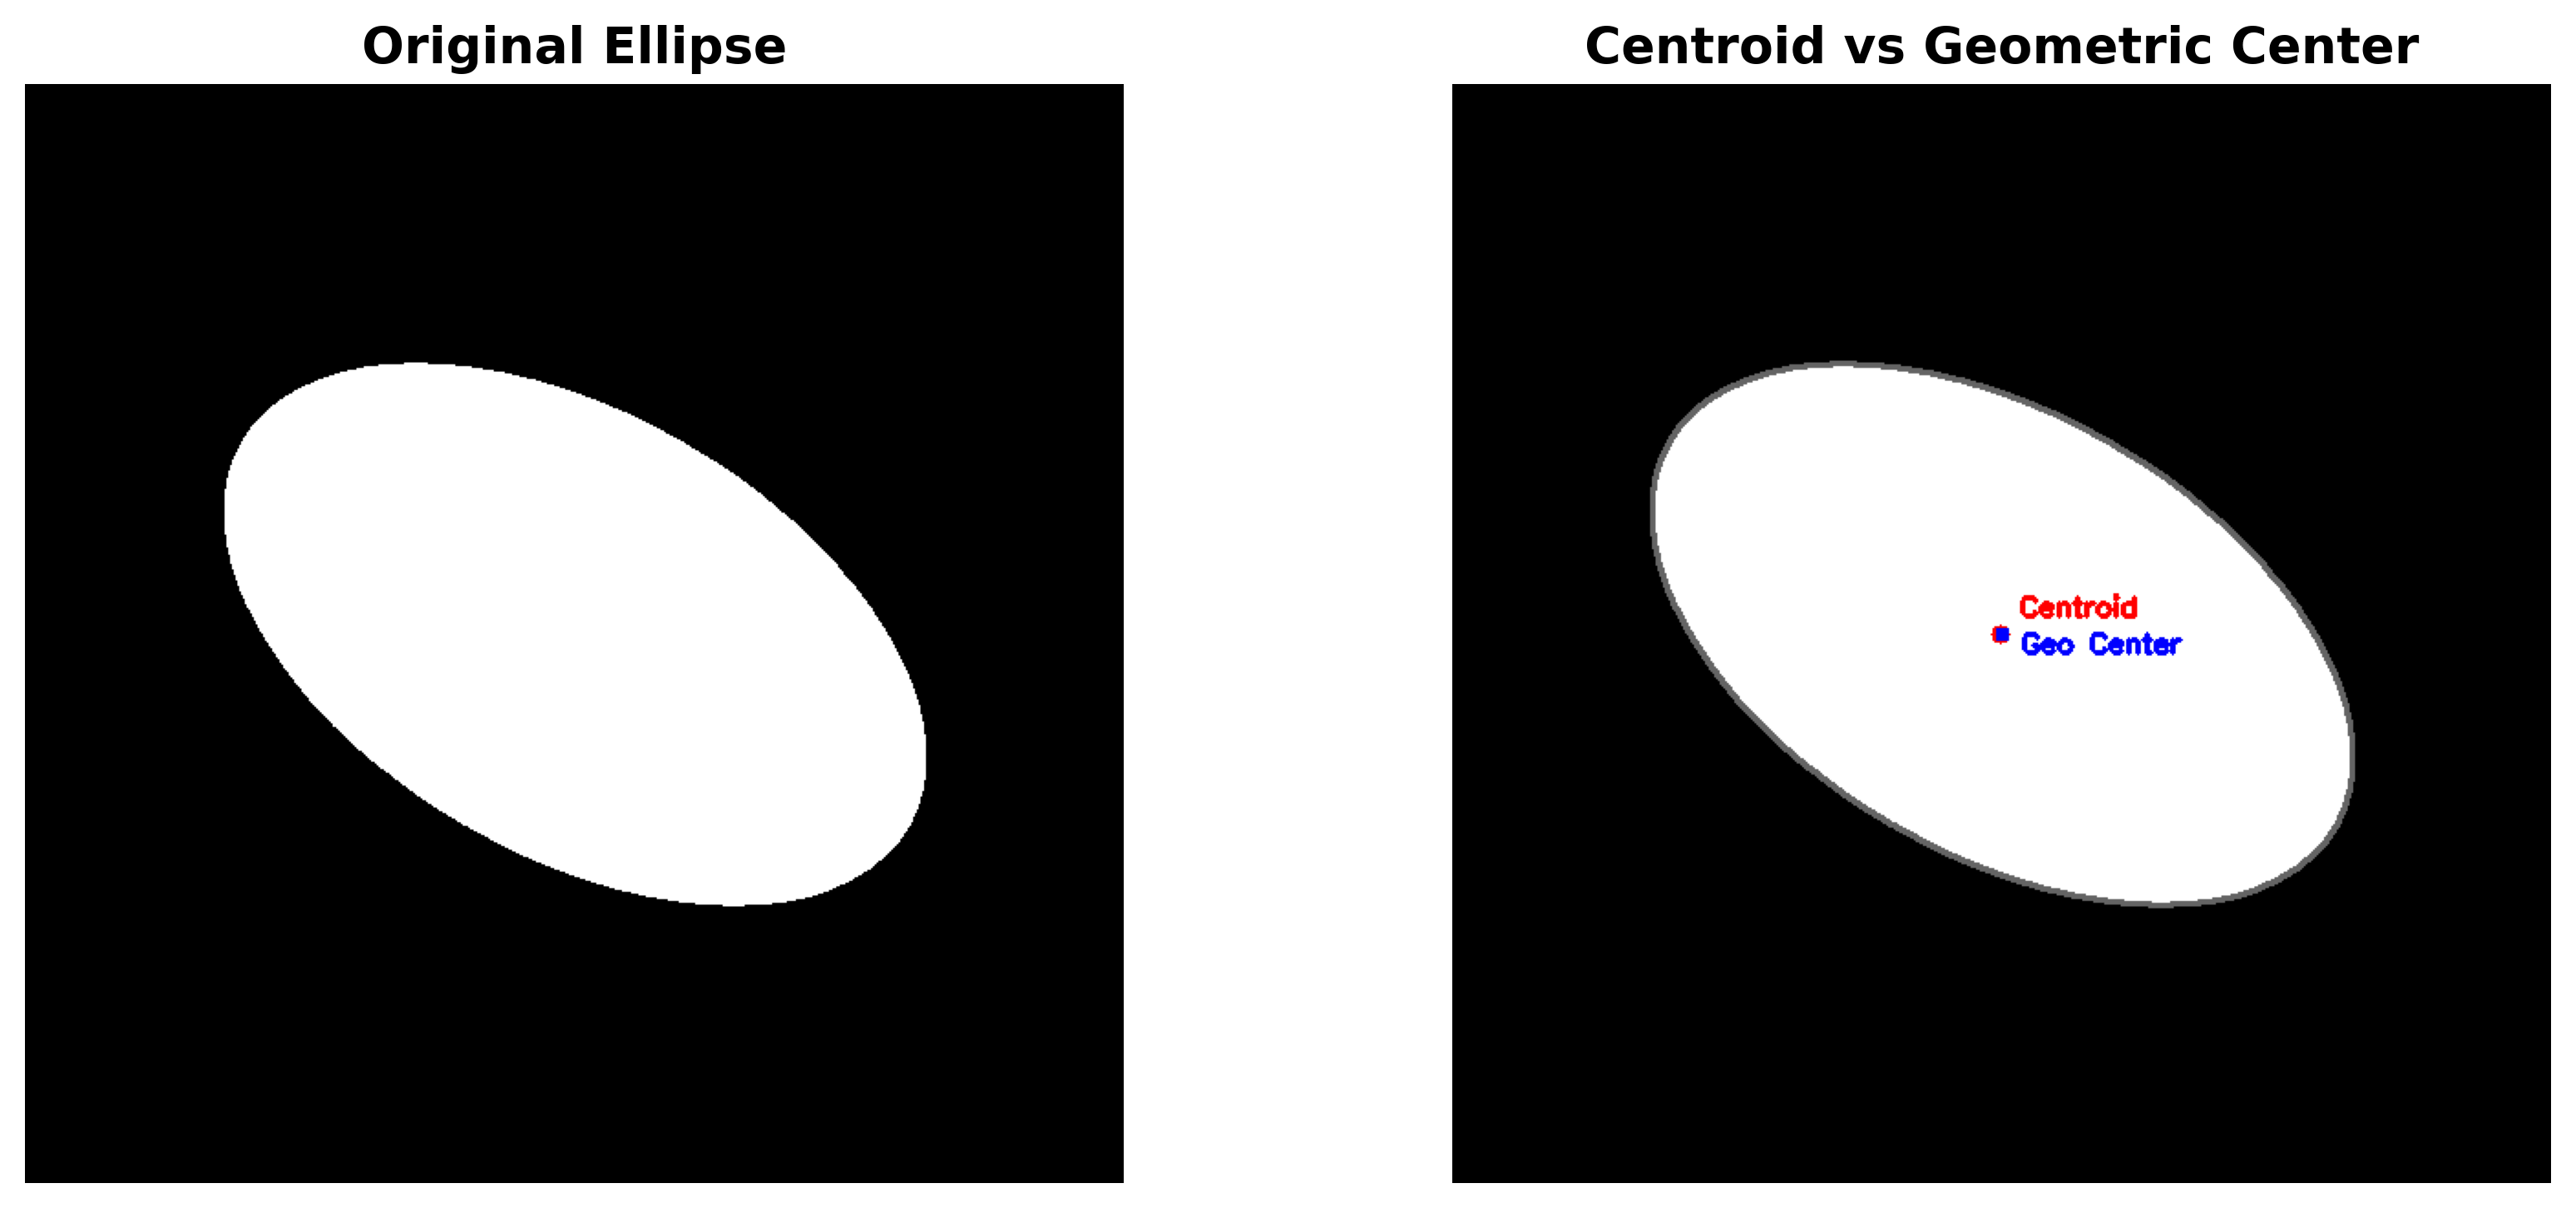
2. Centroid vs Geometric Center
-
Centroid: The center of mass of the shape.
-
Geometric Center: The center point of the smallest rectangle that can completely fit around the shape, regardless of how it's shaped inside.
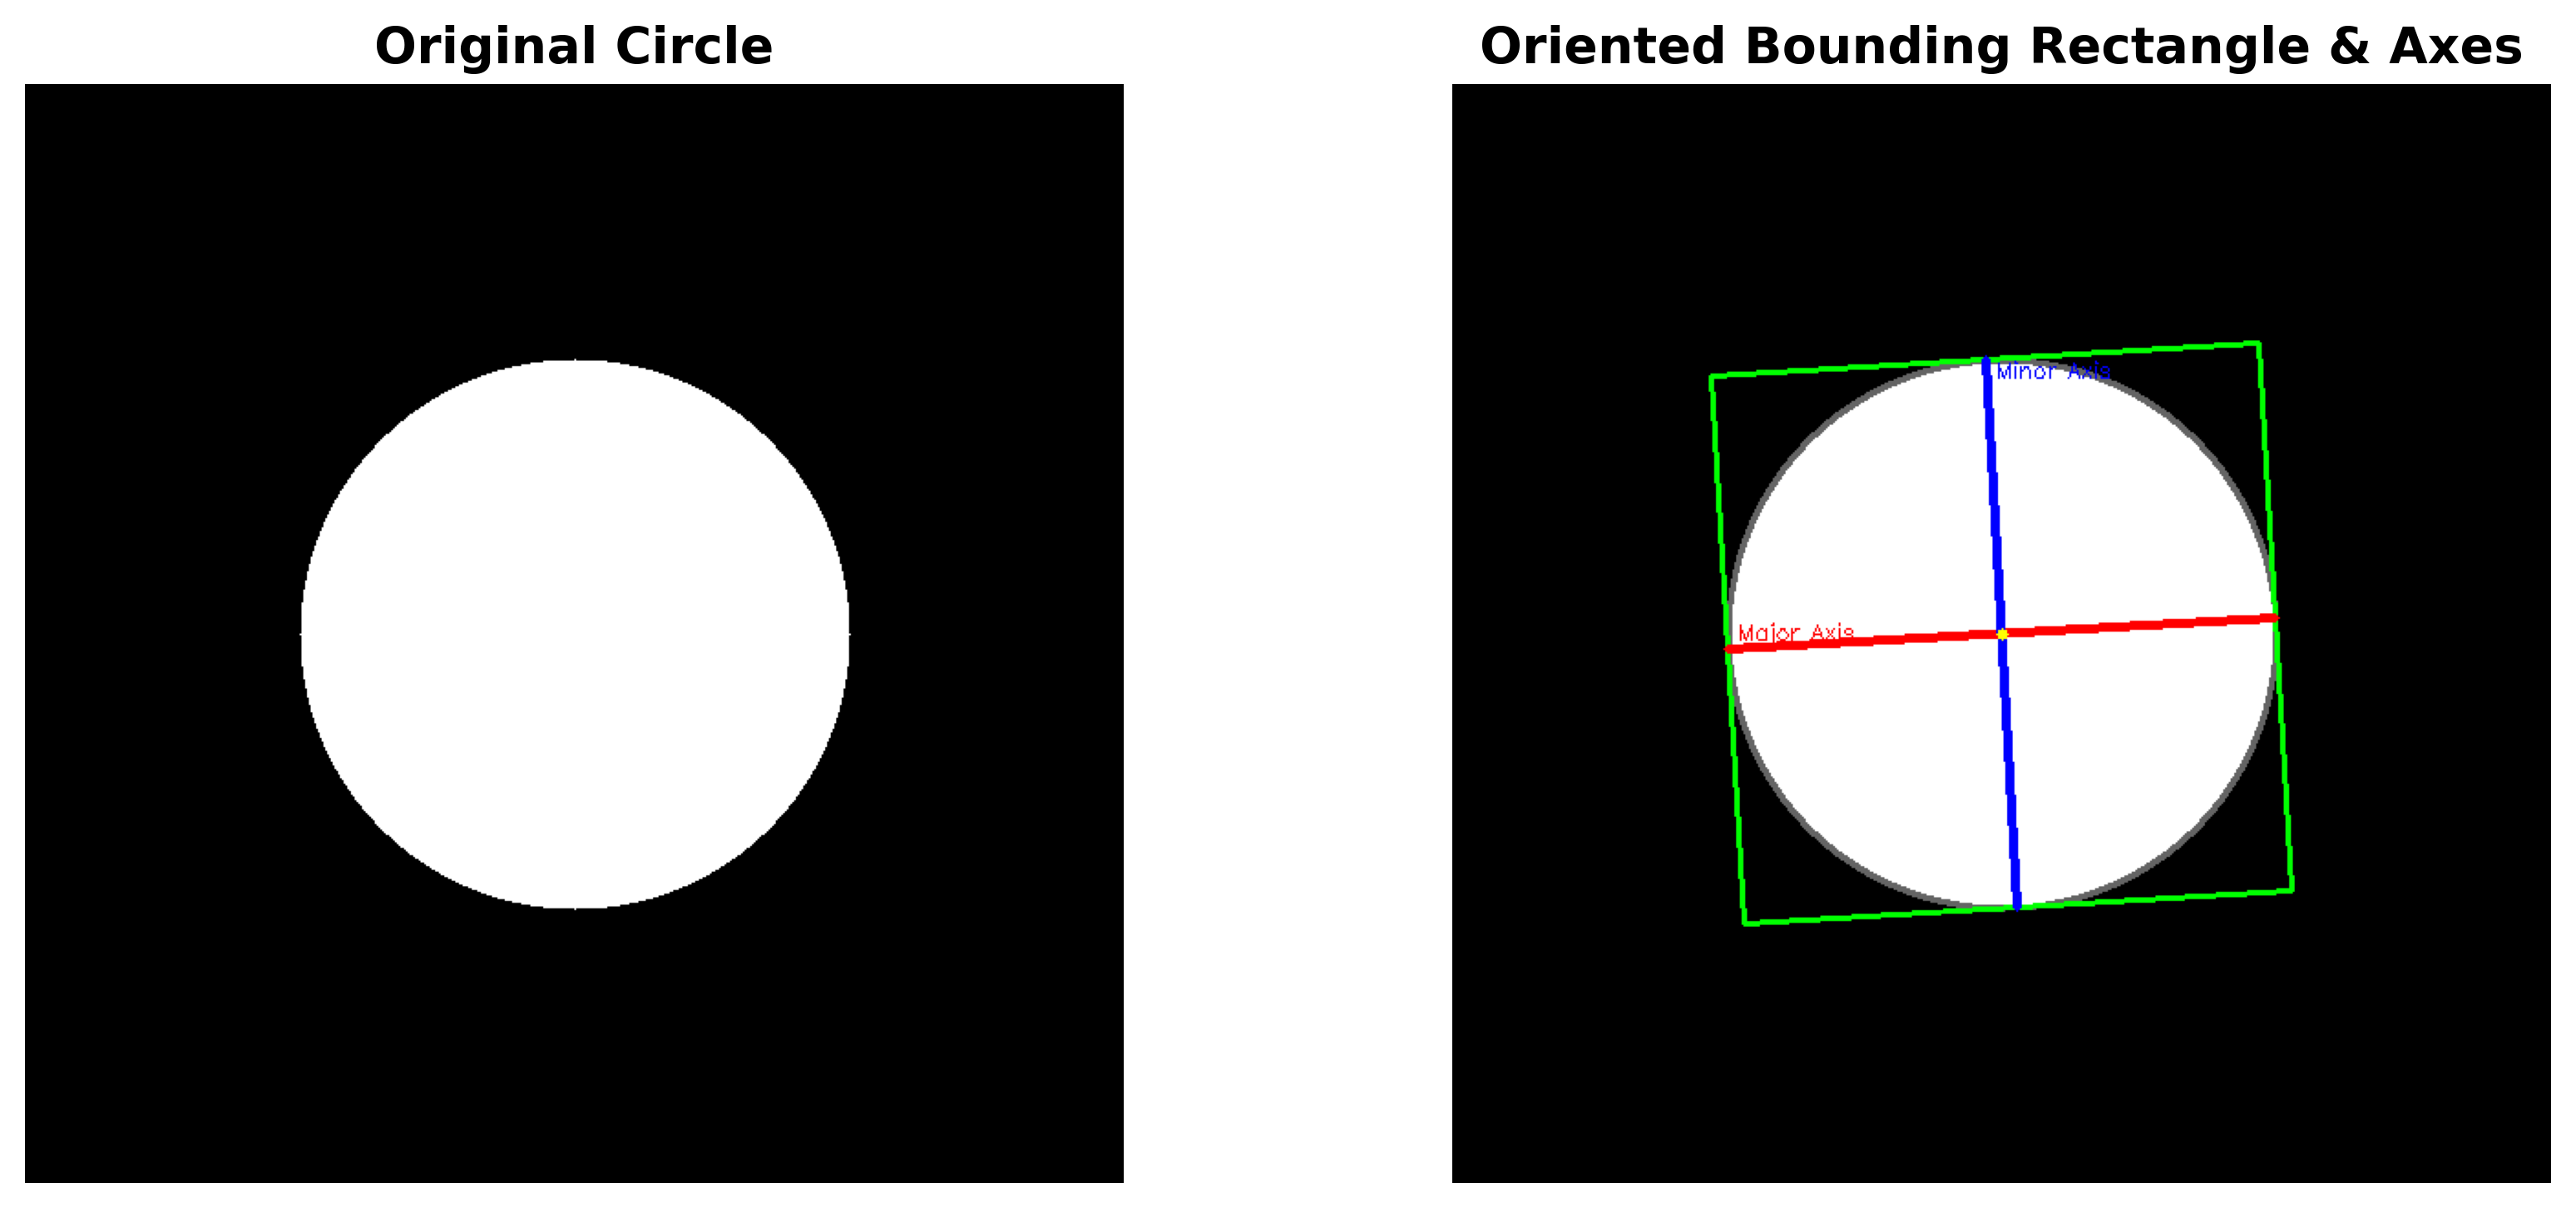
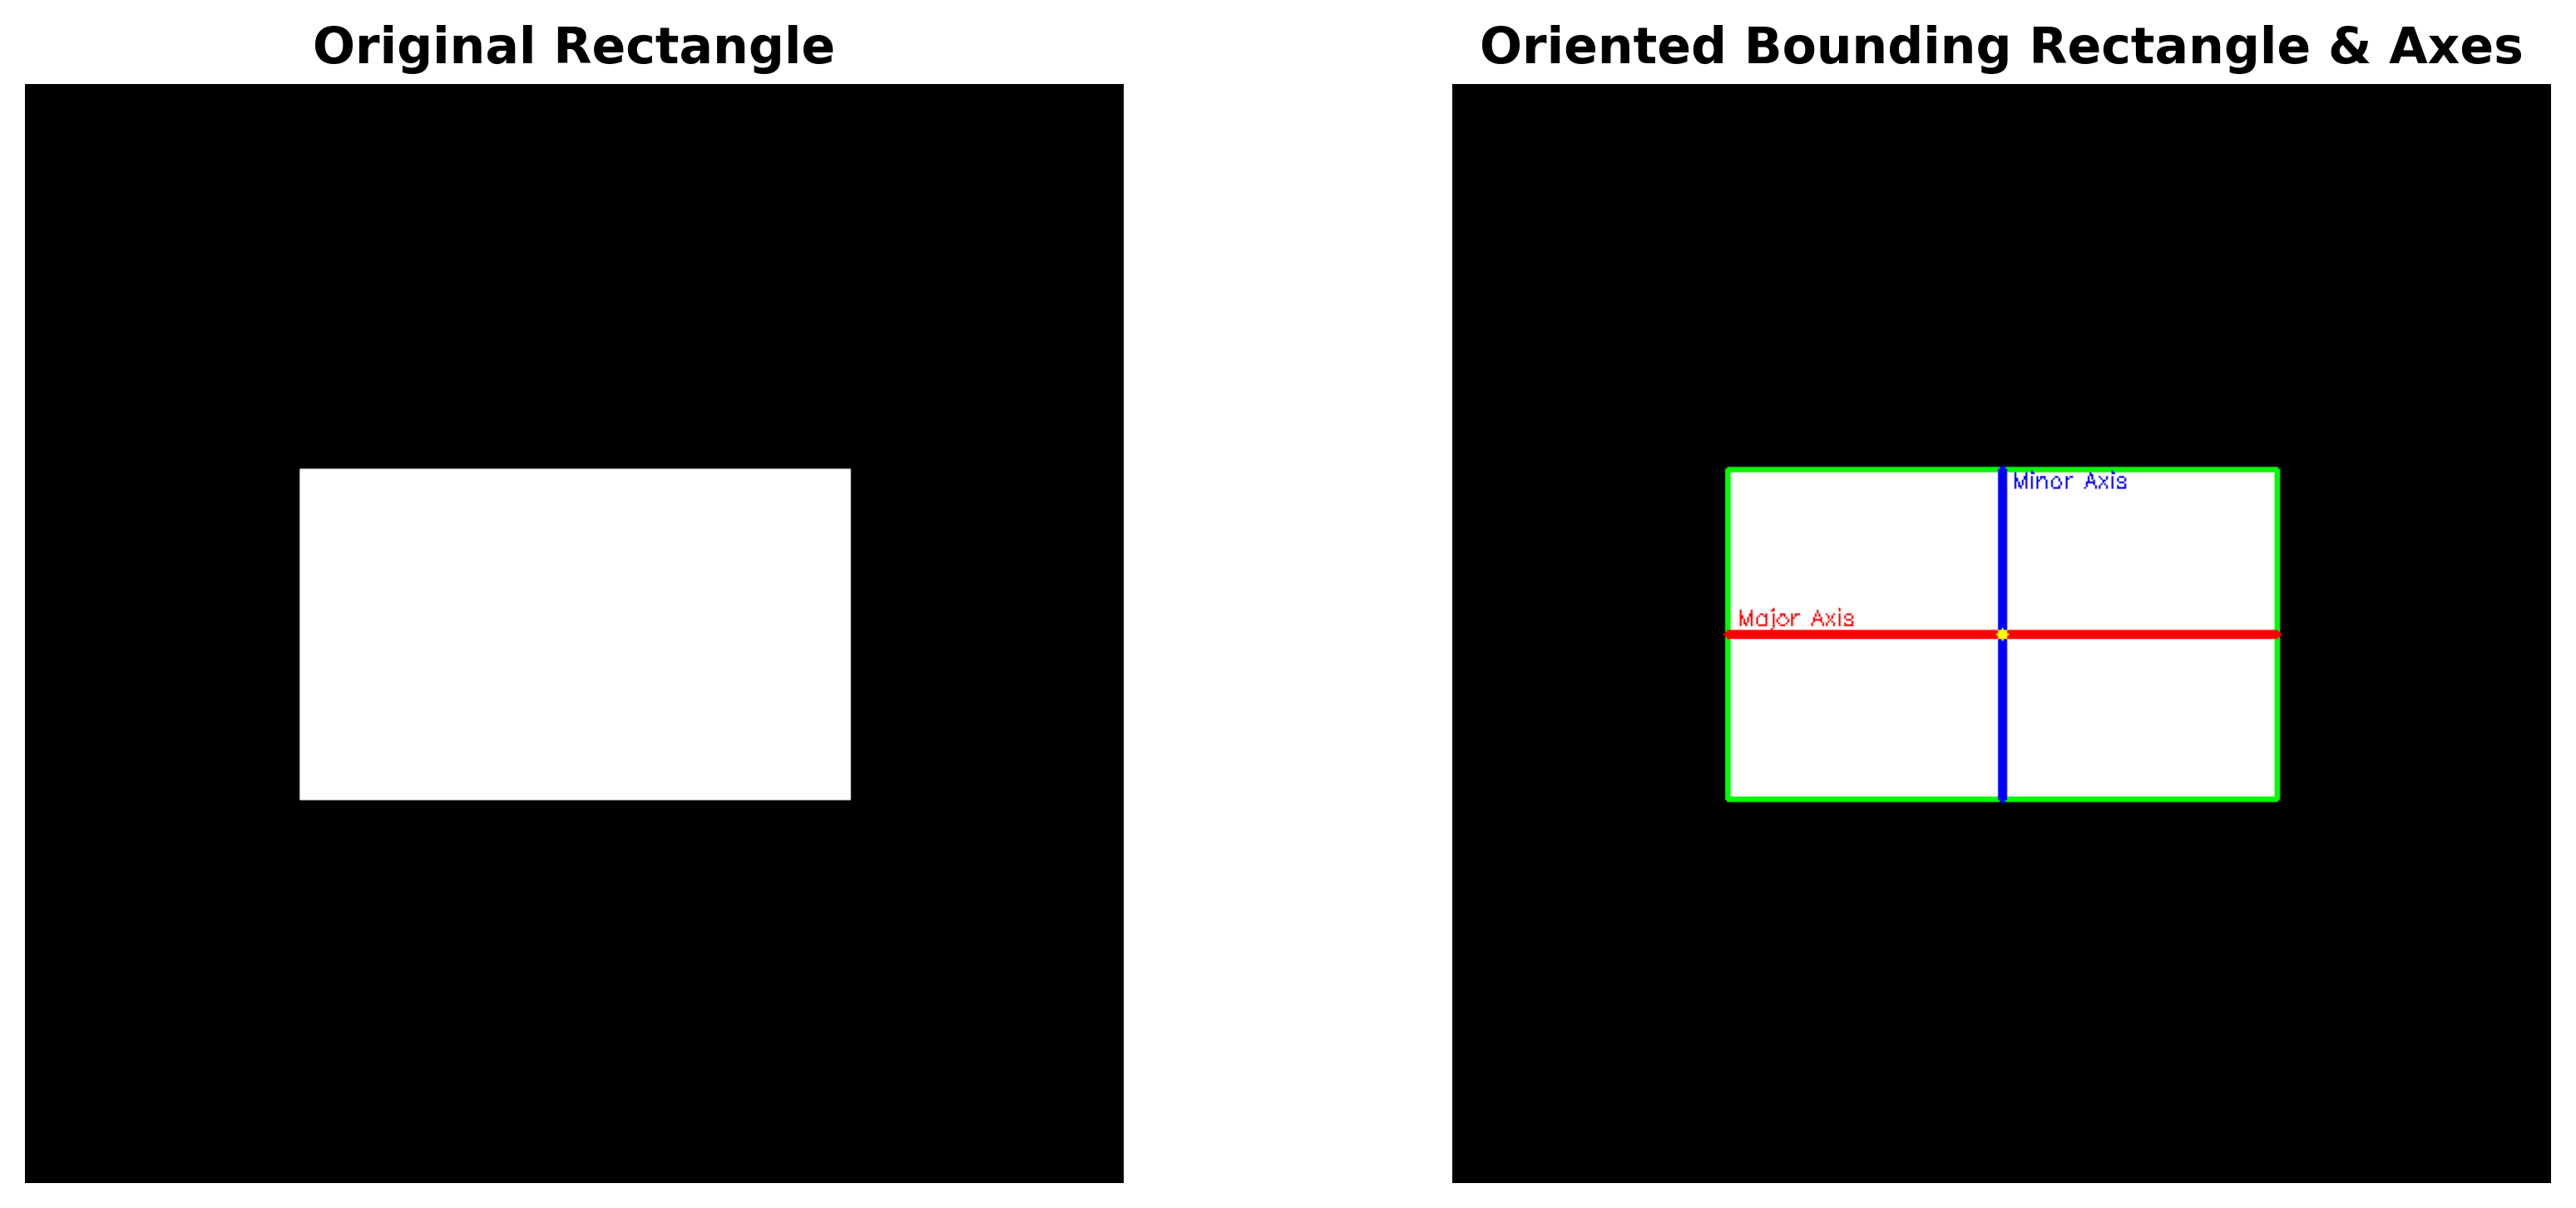
3. Length of Major and Minor Axes
These tell us how long and wide a shape is.
- Major Axis: The longest part
- Minor Axis: The shortest part
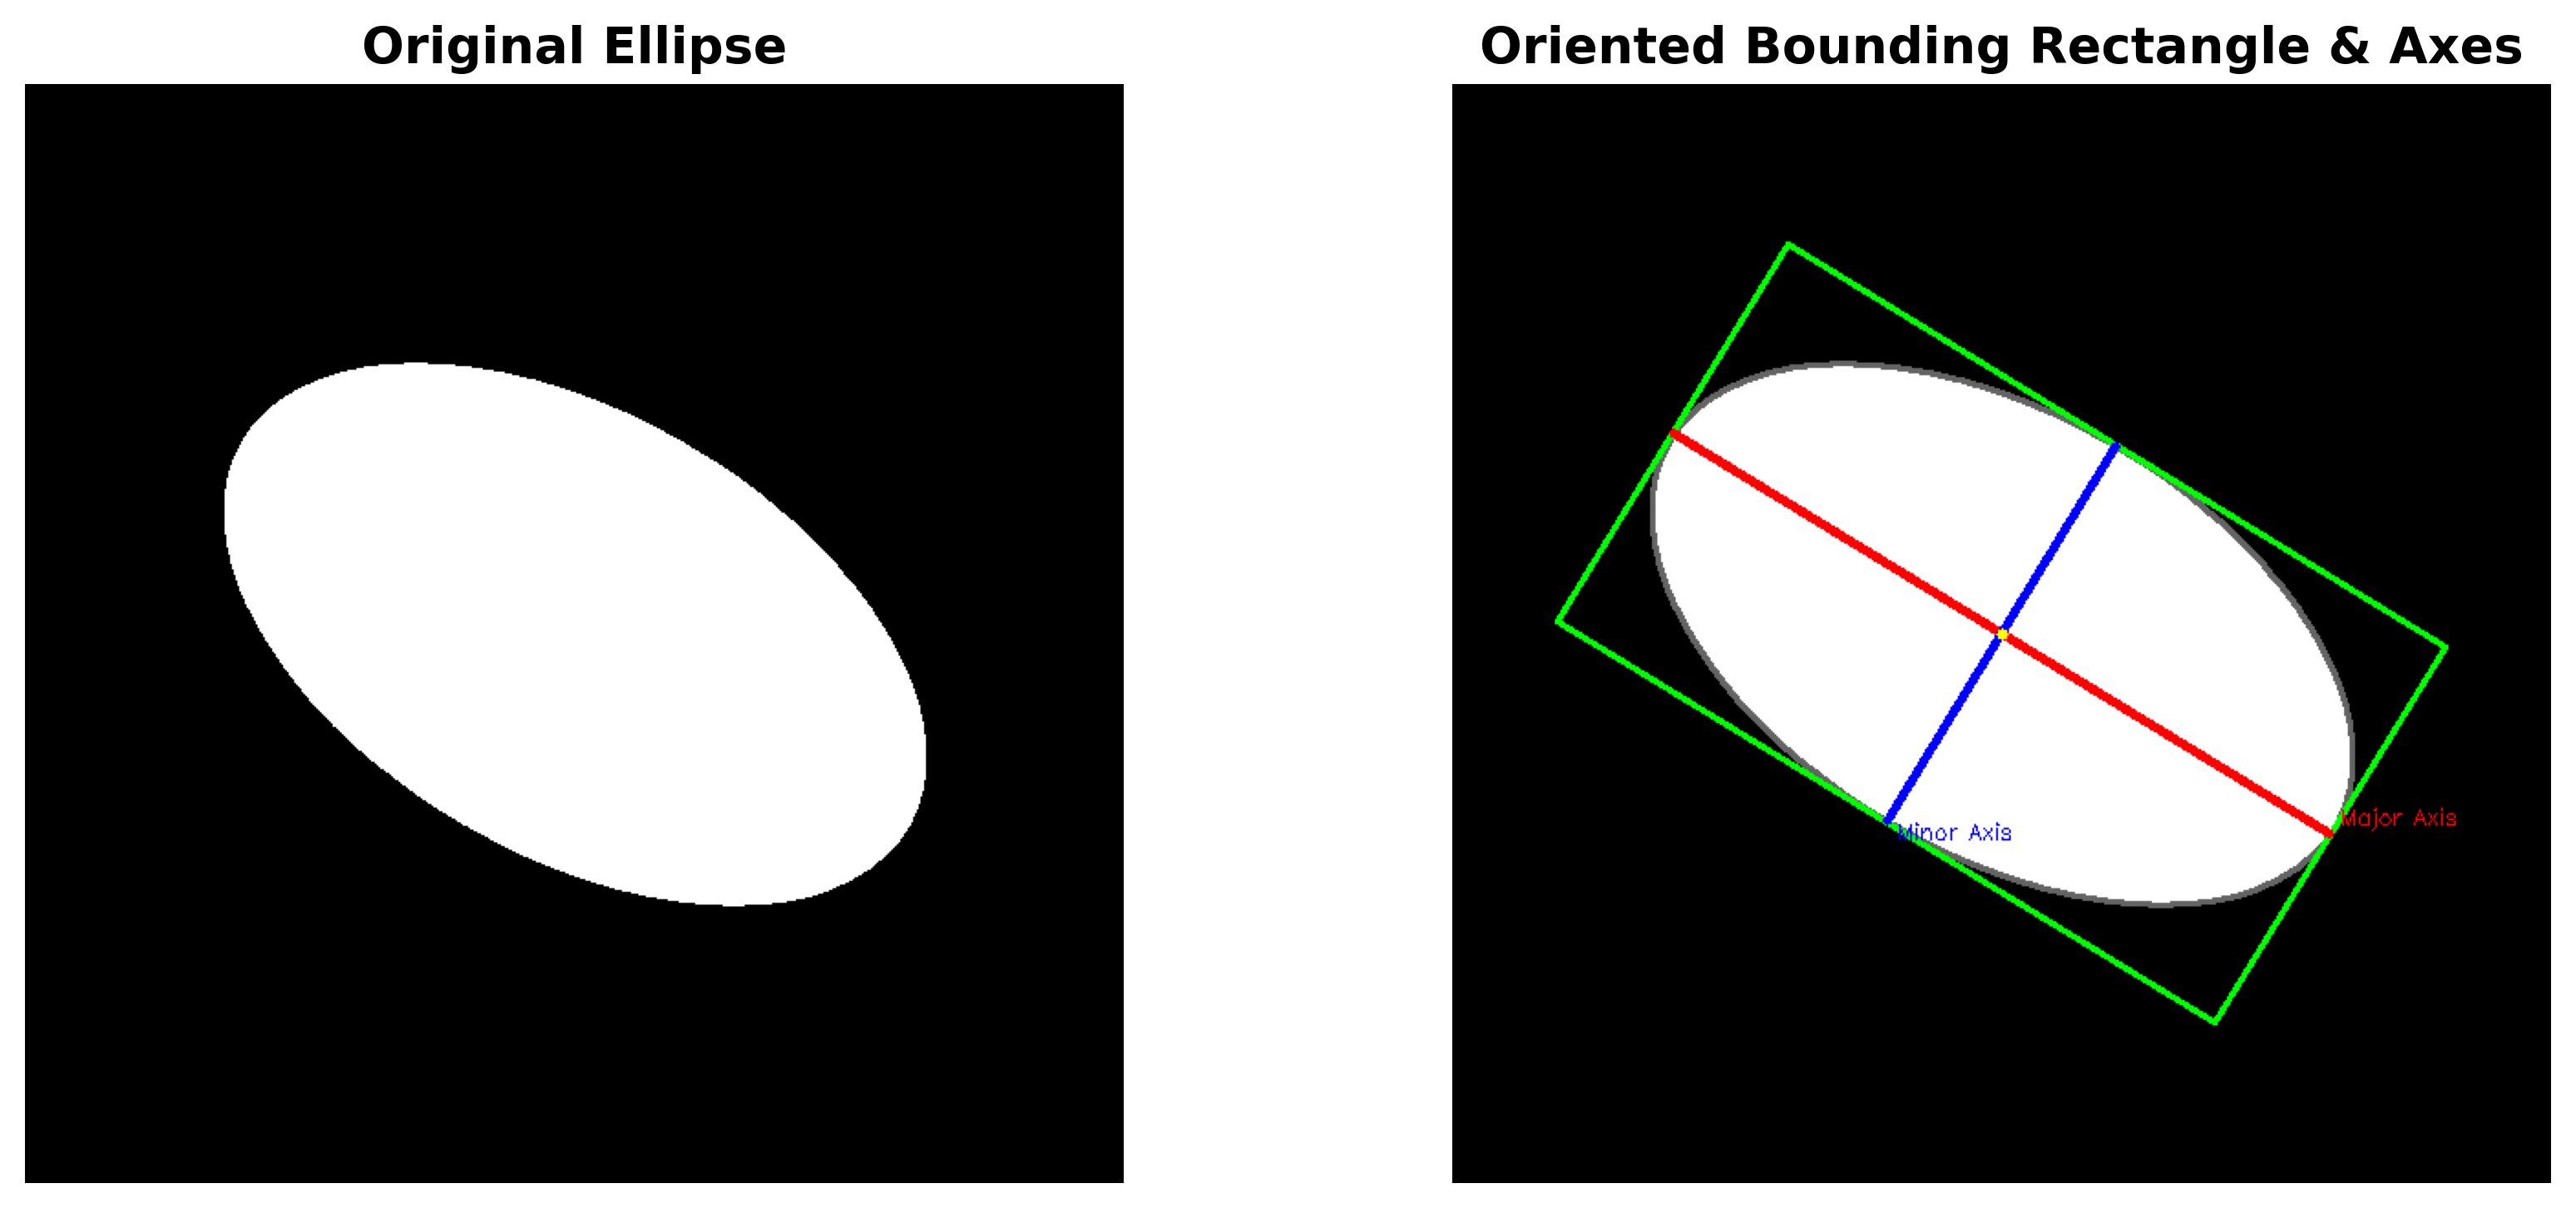
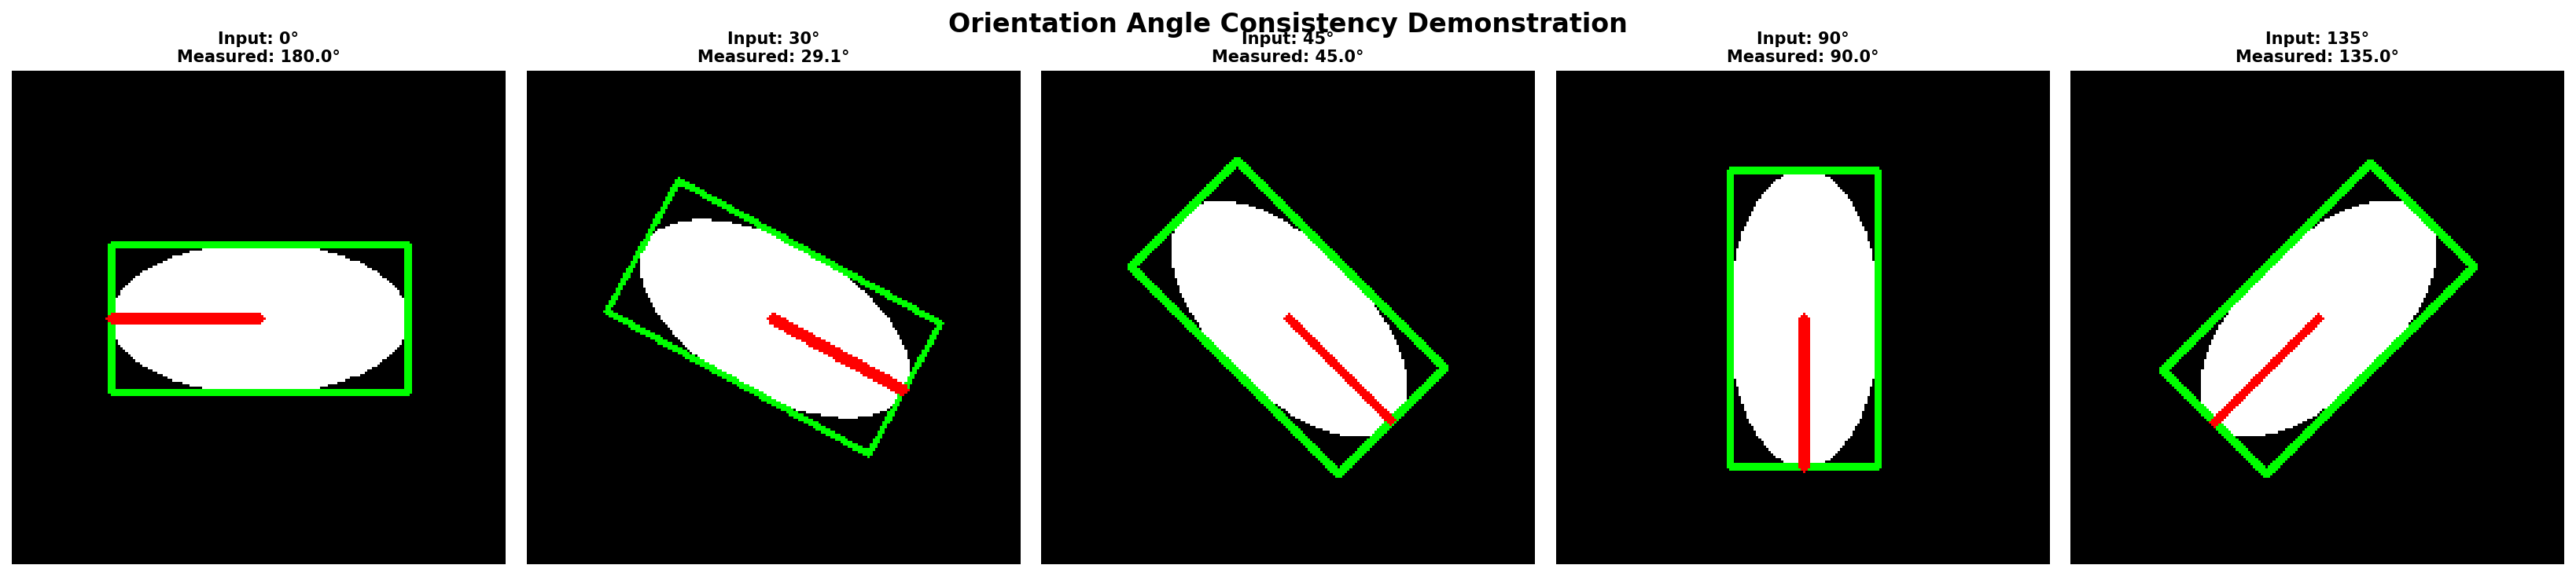
4. Orientation (Angle)
This tells us how tilted the shape is.
- Angle: Measured from the left side (horizontal)
- Use Case: Helps to know the orientation of the part
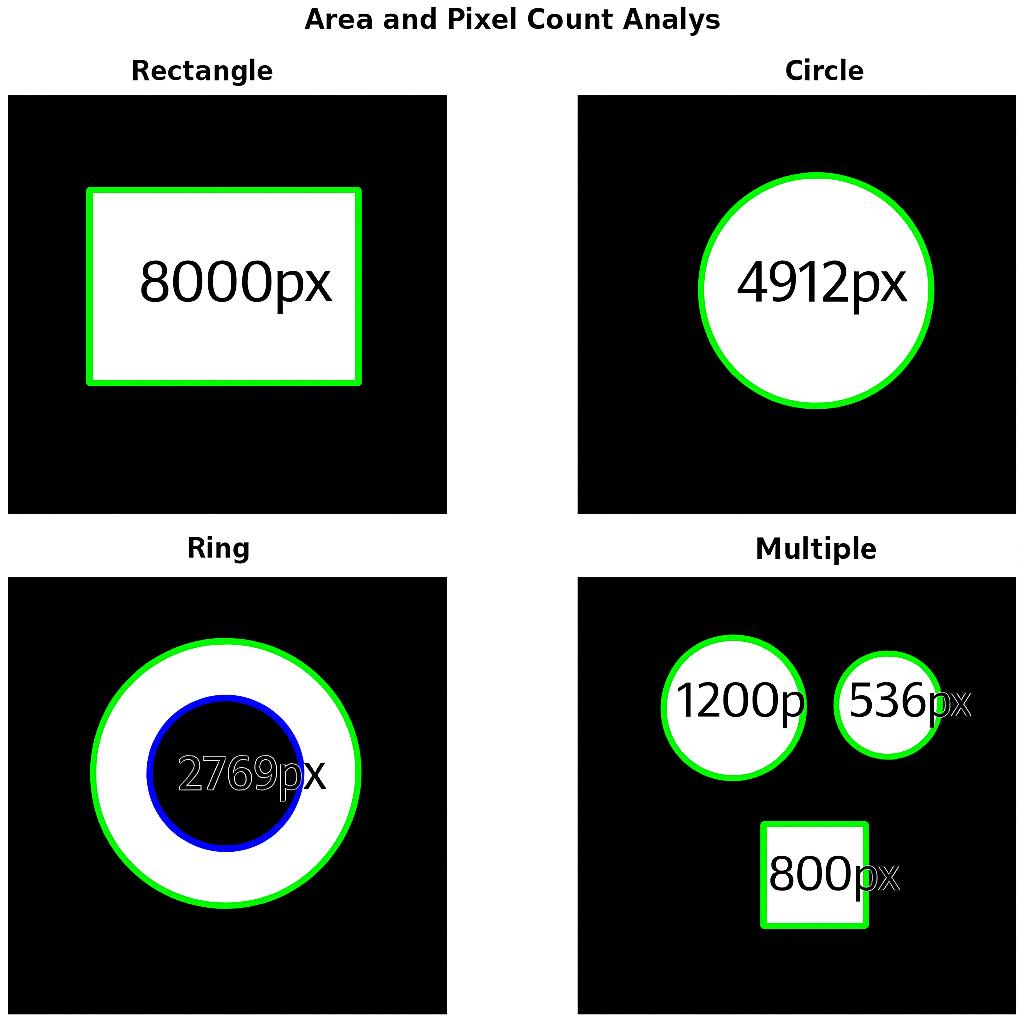
5. Area (Pixel Count)
Area is the size of the blob based on how many pixels it takes up.
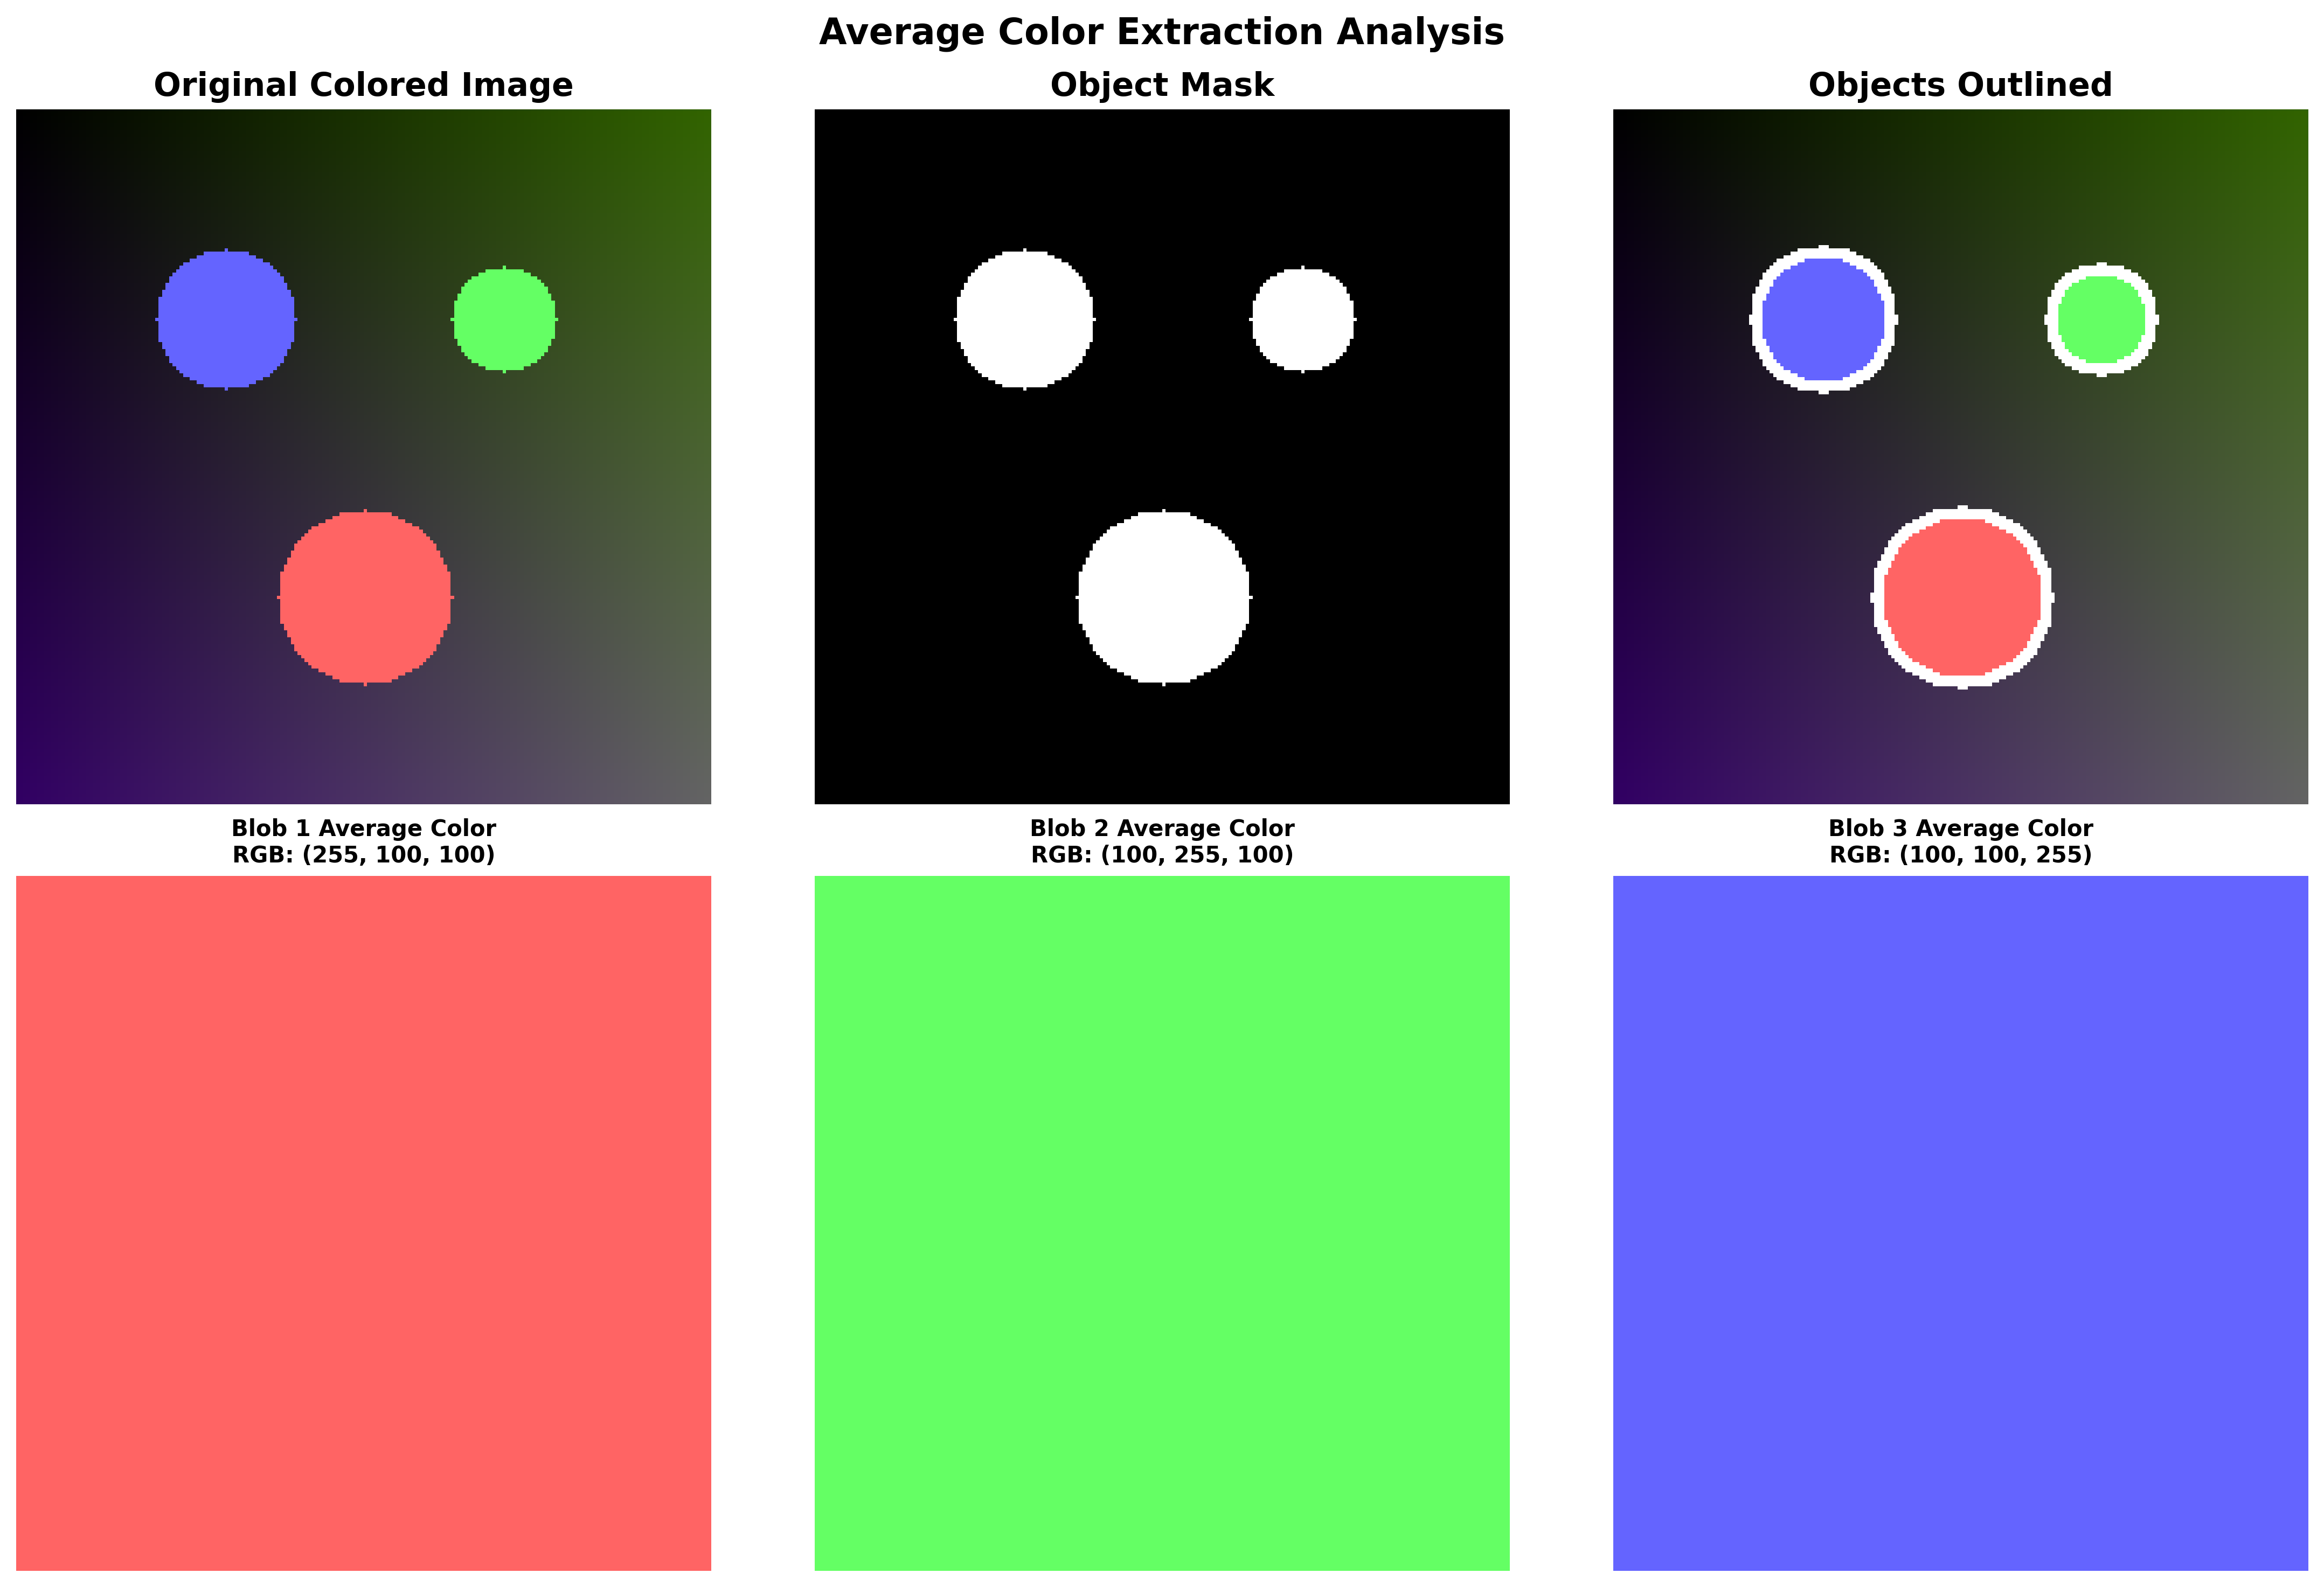
6. Average Color
We can figure out what color the blob is on average.
- Great for checking paint, labels, or color defects
- Works with any color format (RGB, BGR, etc.)
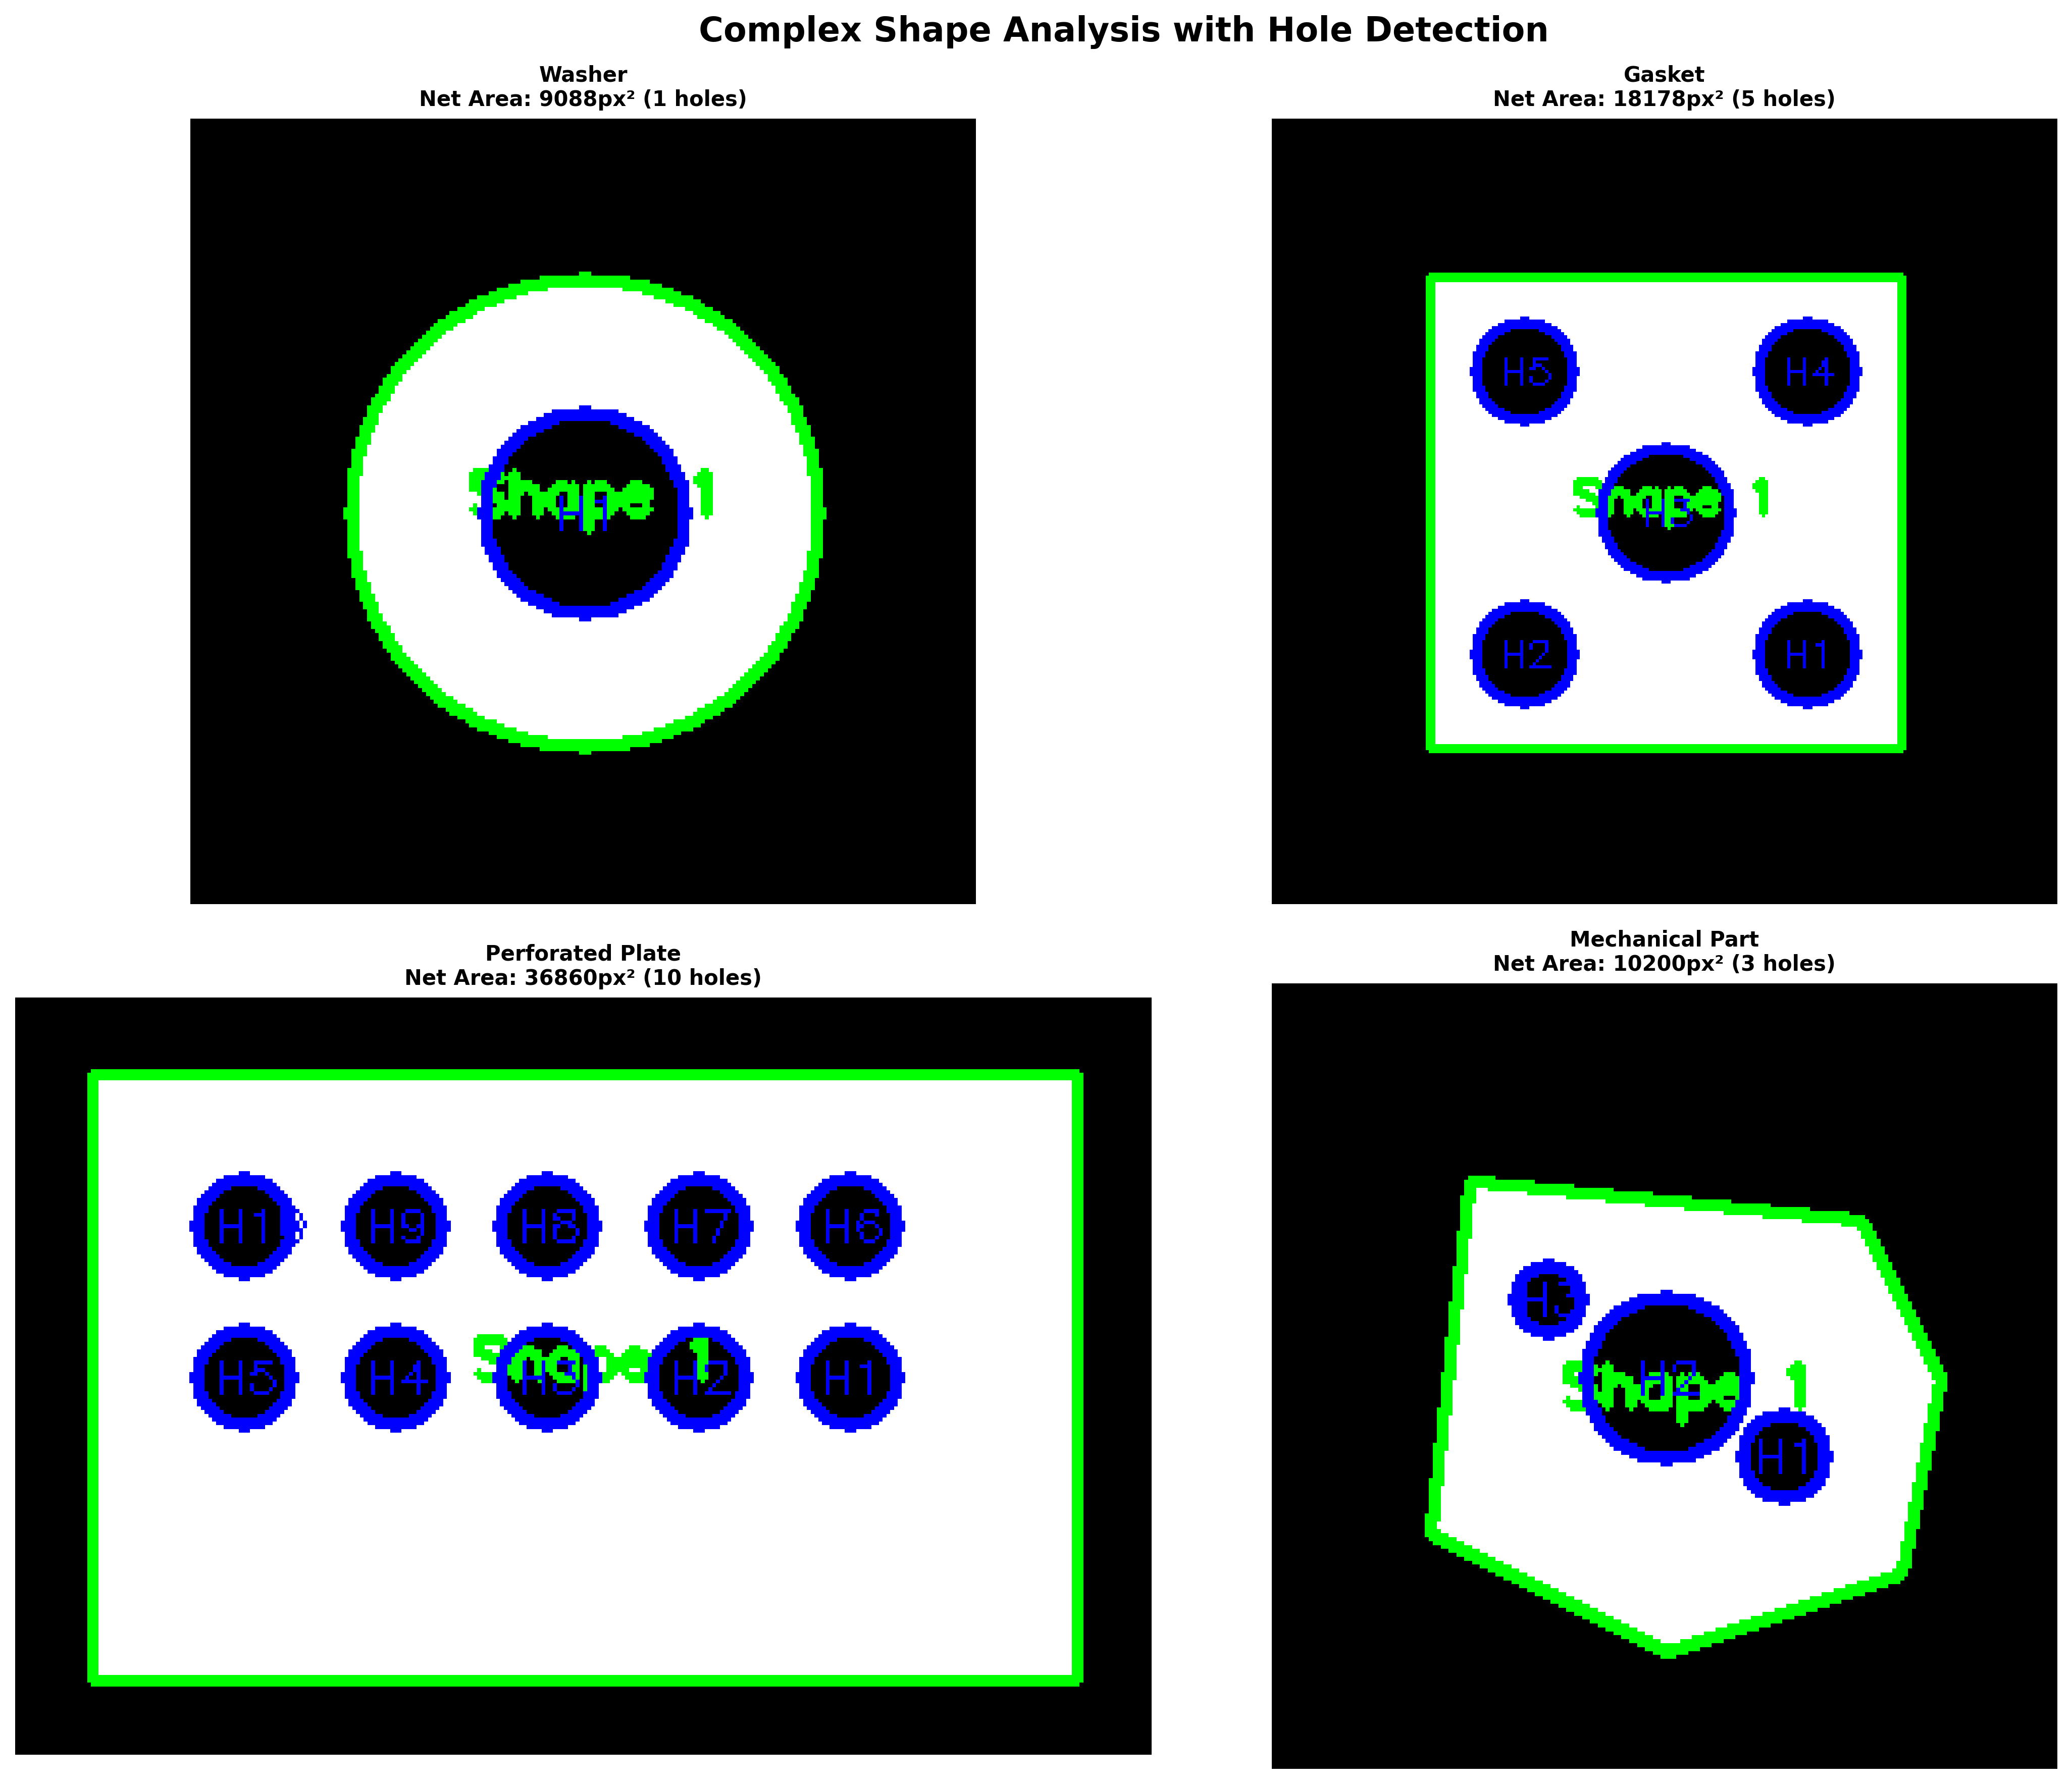
7. Complex Shapes with Holes
Some shapes have holes inside, like washers or gaskets. We can still measure them accurately.
- Detects all the inside and outside edges
- Handles many layers of shapes
8. Real-Life Examples
| Industry | Example Use | Blob Data Used | Why It Helps |
|---|---|---|---|
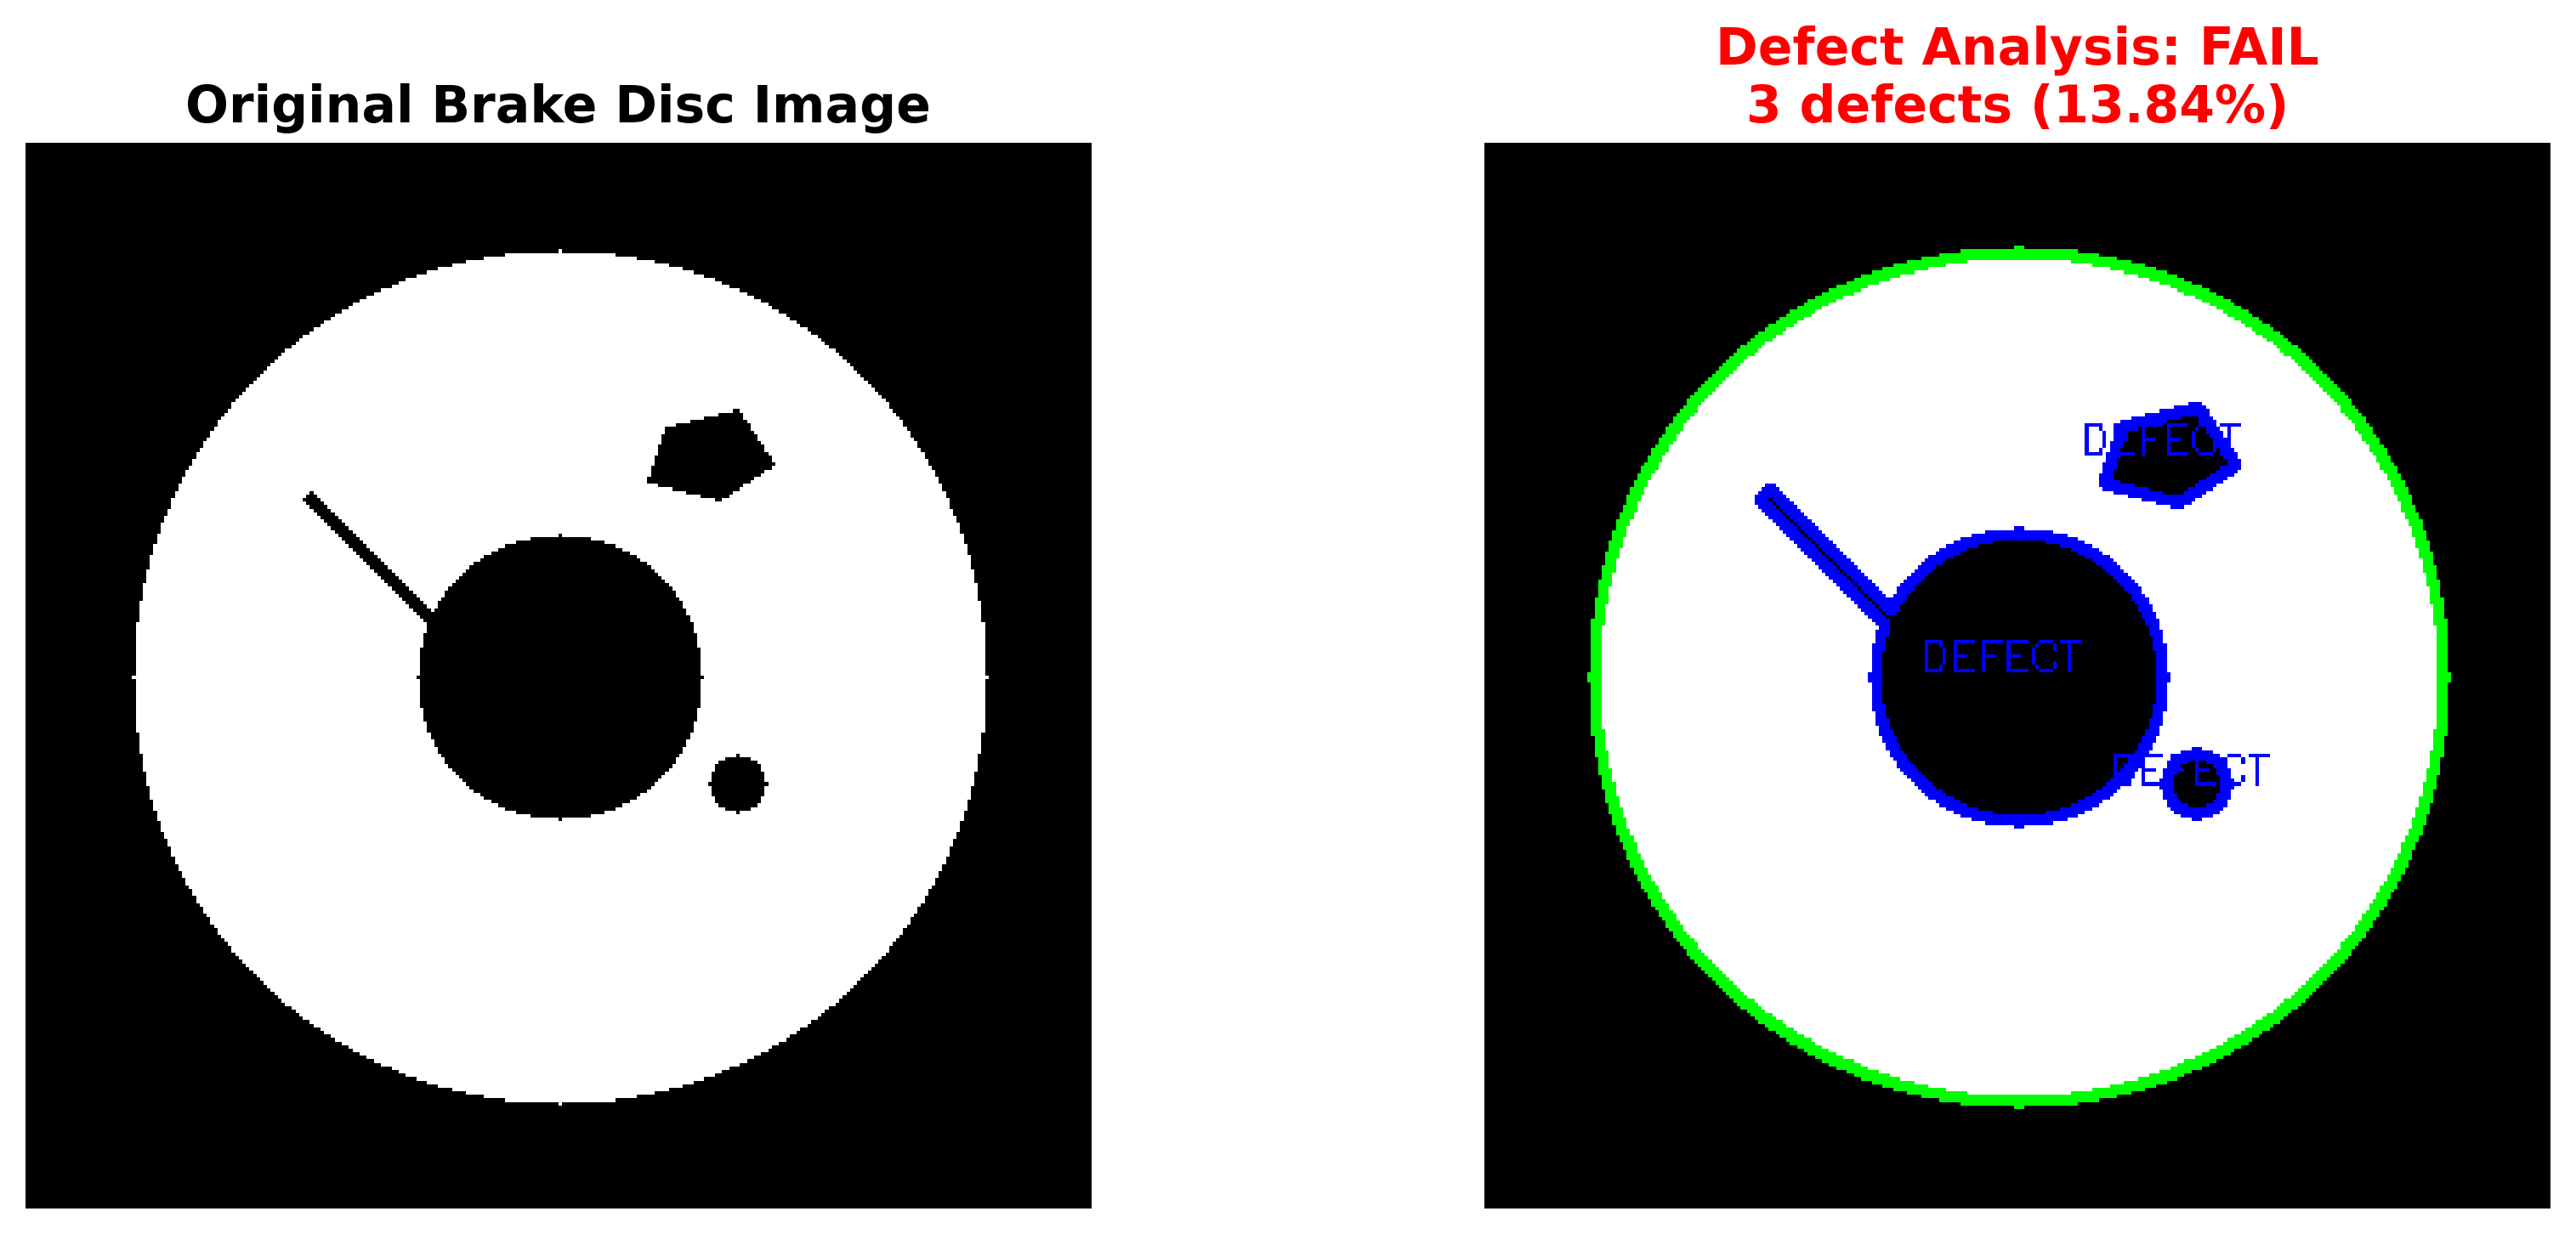
| Car Factory | Catch broken parts | Area, Color, Shape | Fewer mistakes |
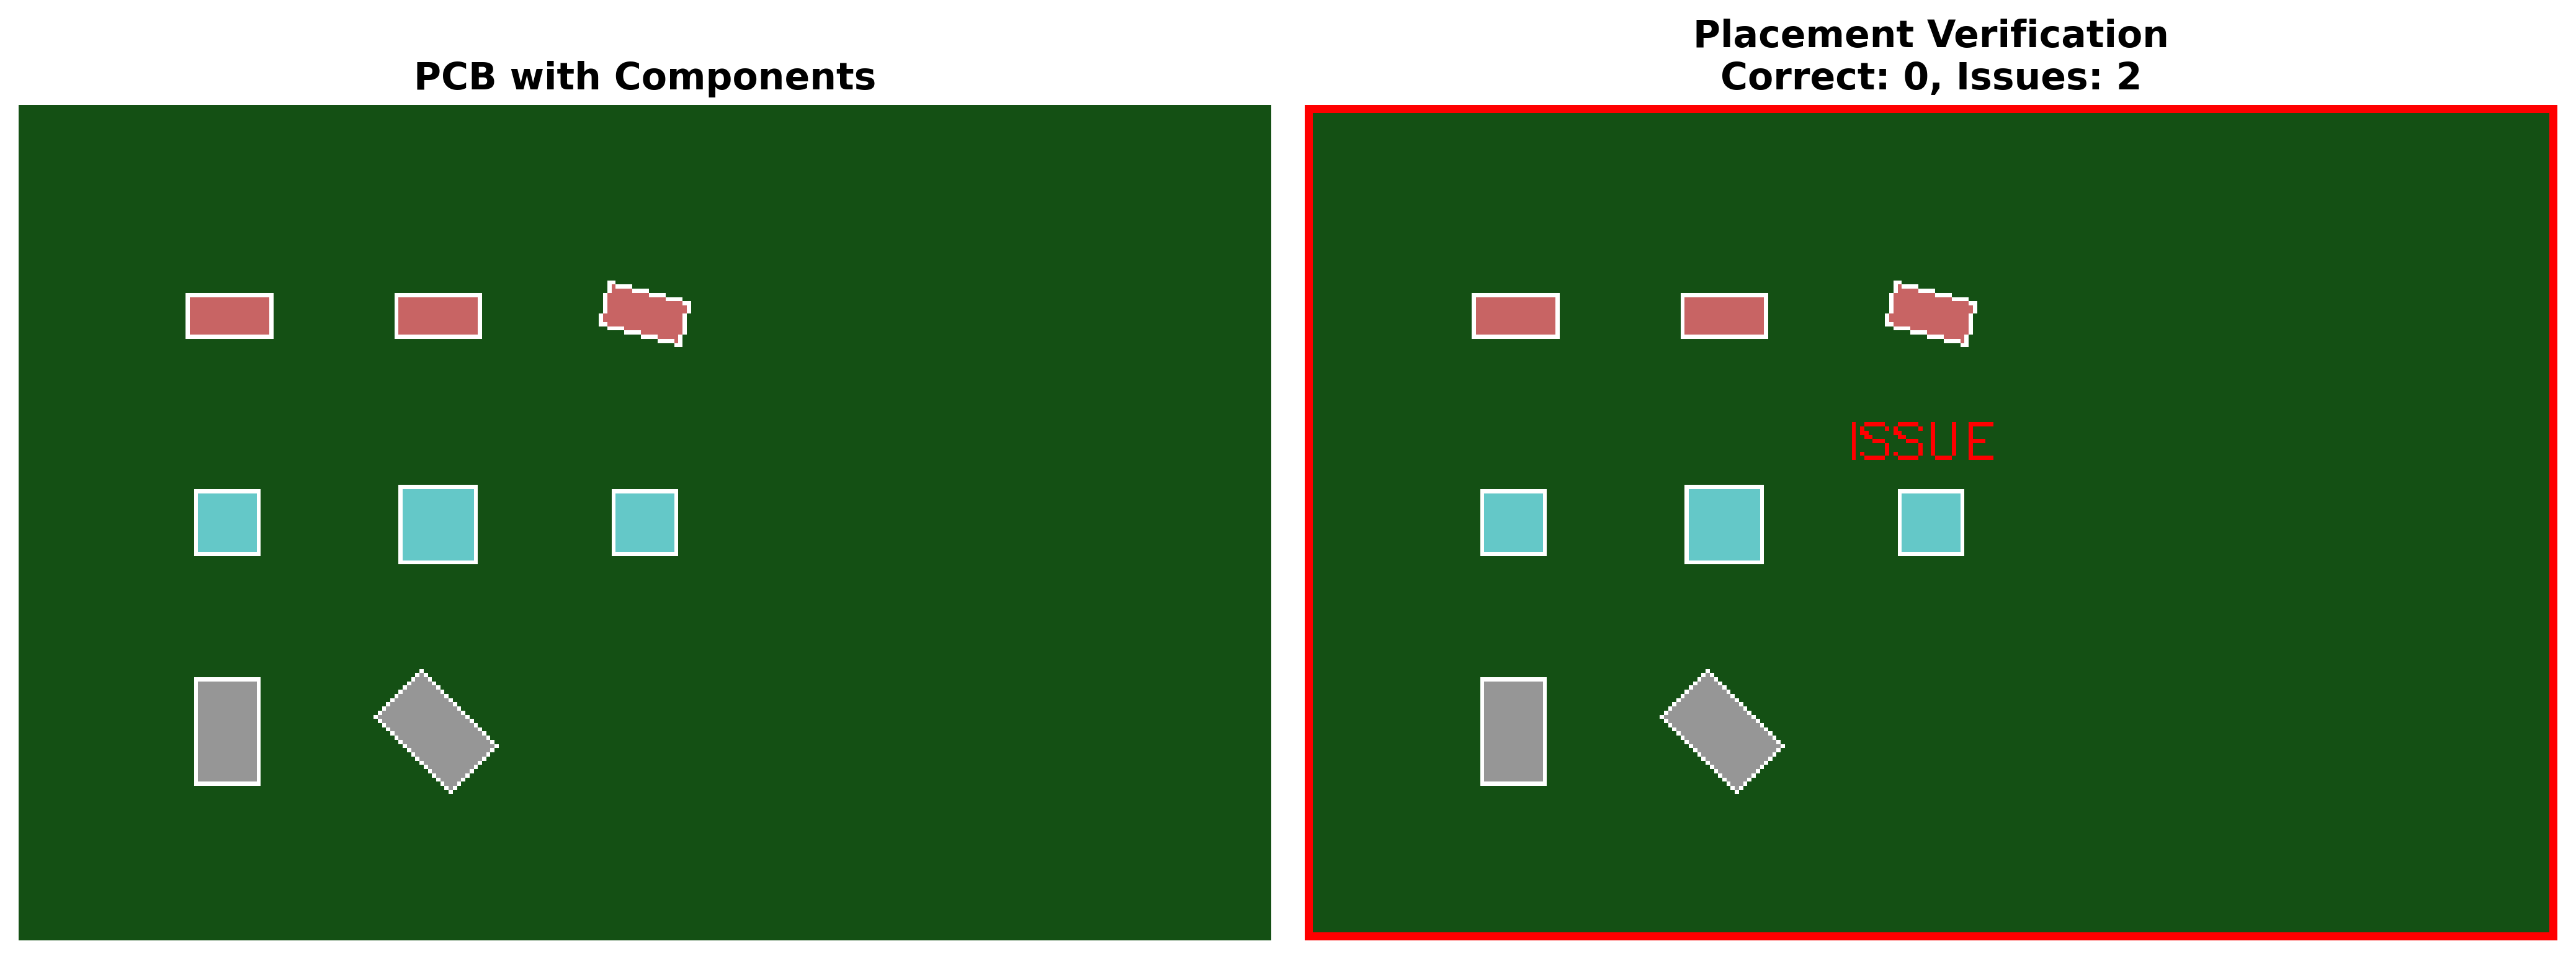
| Electronics | Check PCB parts | Position, Size | Better quality |
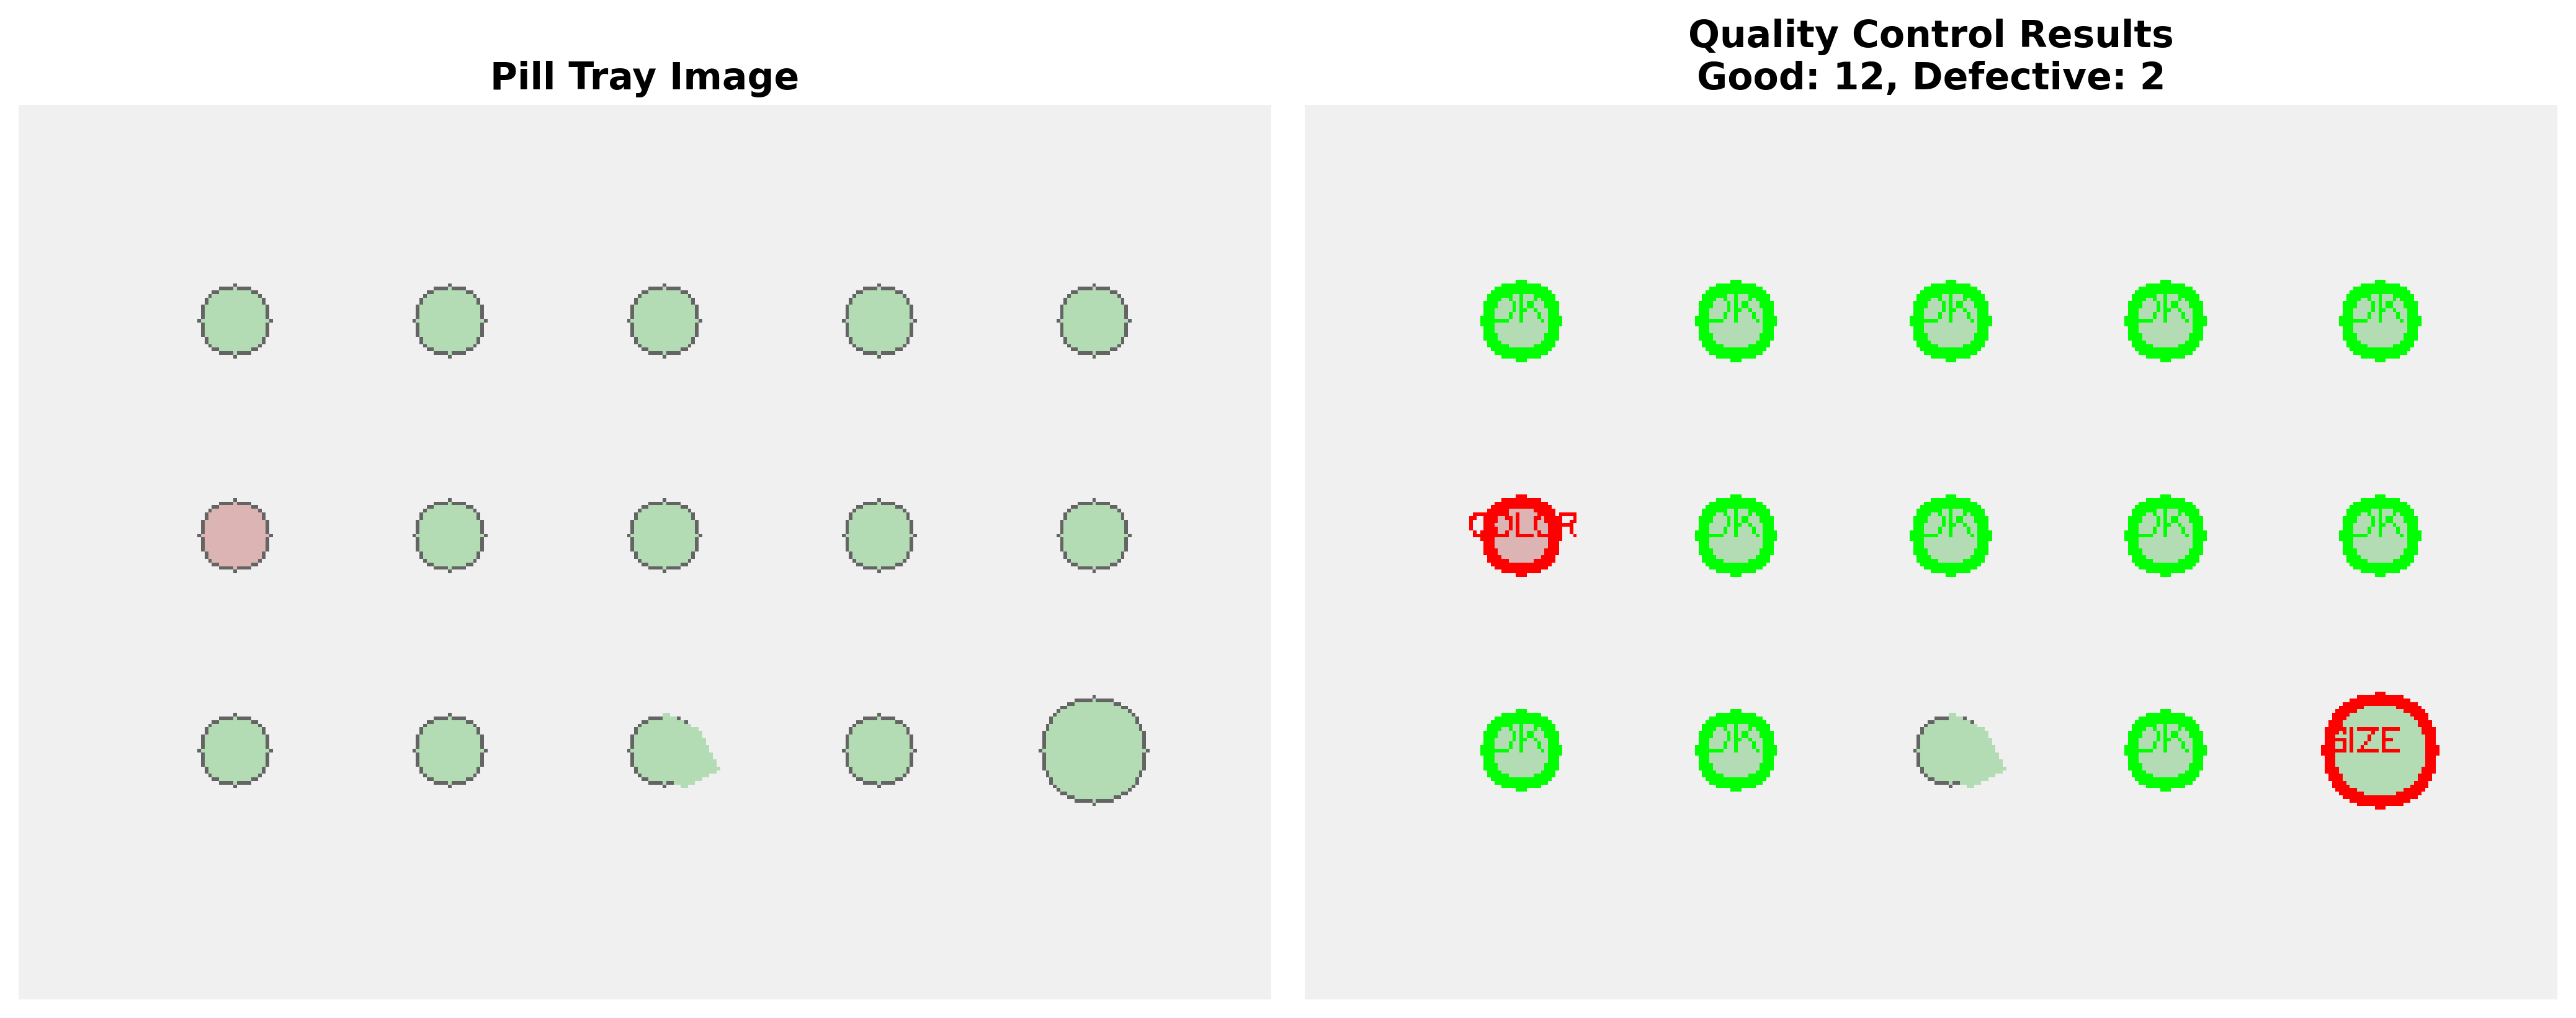
| Medicine | Count pills | Count, Color, Size | Right dosage |
| Food | Check seals on packages | Perimeter, Color | Stop leaks |
| Fabric | Spot fabric flaws | Area, Color | Less waste |
| Metal Parts | Measure cutouts | Hole sizes, Angles | Match design exactly |
9. What the System Gives You
| Feature | What It Means |
|---|---|
| Centroid | Where the blob’s center of mass is |
| Center Point | Center of the smallest rectangle around it |
| Angle | How tilted the shape is |
| Major Axis | Longest part of the blob |
| Minor Axis | Shortest part |
| Perimeter | How long the outline is |
| Area | How many pixels are in the shape |
| Color | Average color inside the blob |